BASIC GUIDE
How to choose the right KPIs for your team
Knowing what a KPI is is the first step. The second (and harder) one is choosing which ones to use. Many teams fall into the trap of measuring everything: 30 metrics on a panel that nobody checks because they don't know where to start.
A good dashboard has few KPIs, all tied to concrete decisions.
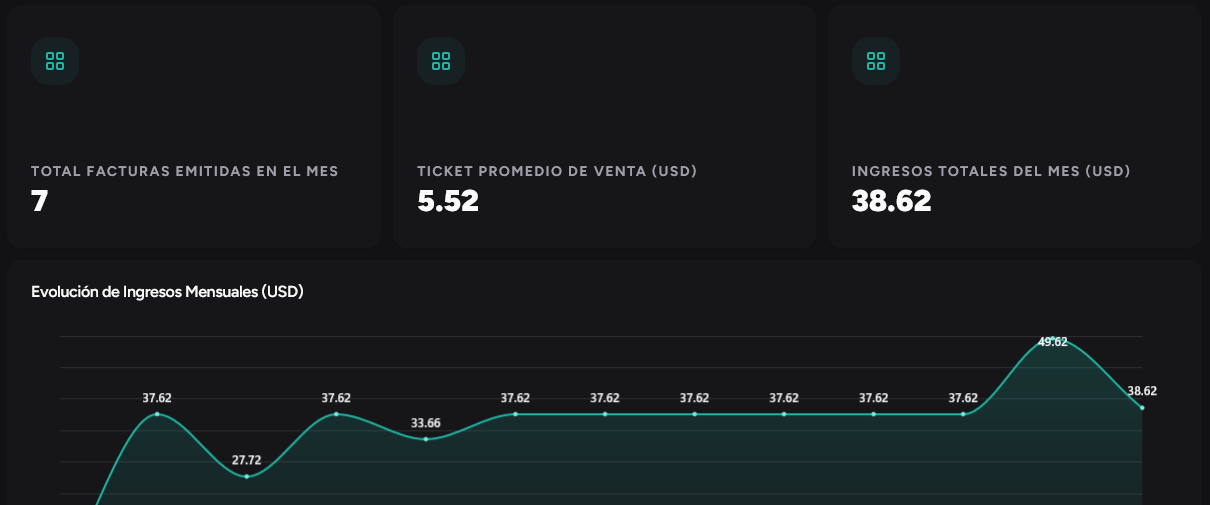
The 80/20 rule of KPIs
- Maximum 4–6 KPIs per dashboard or tab
- Each KPI must answer: "What do I do if this number goes up or down?"
- If nobody acts when it changes, it's not a KPI: it's decoration
Outcome KPIs vs process KPIs
| Type | What it measures / Example |
|---|---|
| Outcome — The final result | Revenue, margin, churn |
| Process — What drives the outcome | Conversion rate, cycle time, tickets resolved |
Outcome KPIs tell you if you're on track. Process KPIs tell you why.
KPIs by role
- Leadership: revenue, margin, growth vs goal, cash flow
- Sales manager: pipeline, conversion, average deal size, quota attainment
- Operations: on-time delivery, inventory, efficiency, bottlenecks
- Finance: accounts receivable, expenses vs budget, profitability by product
How to write your dashboard objective
Before choosing KPIs, answer: What decision do I want to make with this panel?
- Bad: "Sales dashboard"
- Good: "Monitor monthly goal attainment and detect salespeople with stalled pipeline before month end"
That objective defines which KPIs to include and which to discard.
Practical example: sales dashboard
- Monthly revenue (outcome)
- % goal attainment (outcome)
- Pipeline conversion rate (process)
- Average deal size (process)
- Stalled opportunities > 30 days (alert)
Five KPIs. All actionable. None decorative.
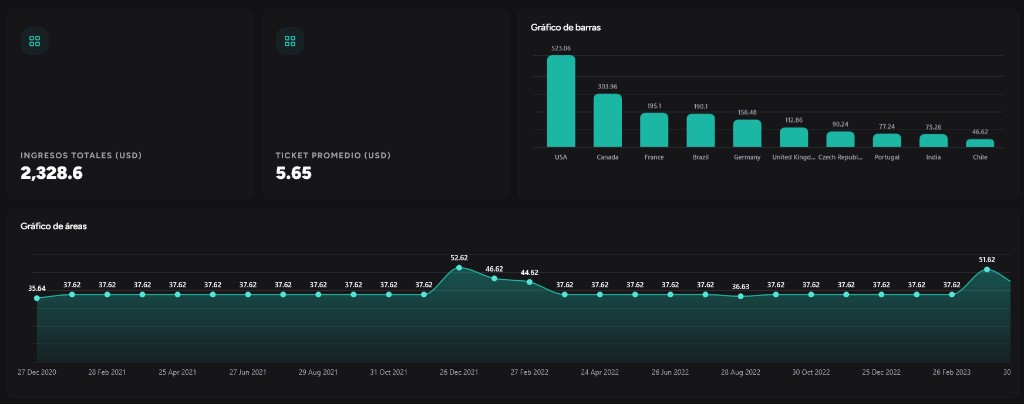
Ready to see your metrics in a dashboard?
Join early access and connect your data in minutes—no SQL or manual reports.