PRACTICAL GUIDE
Build your first AI dashboard in 5 steps
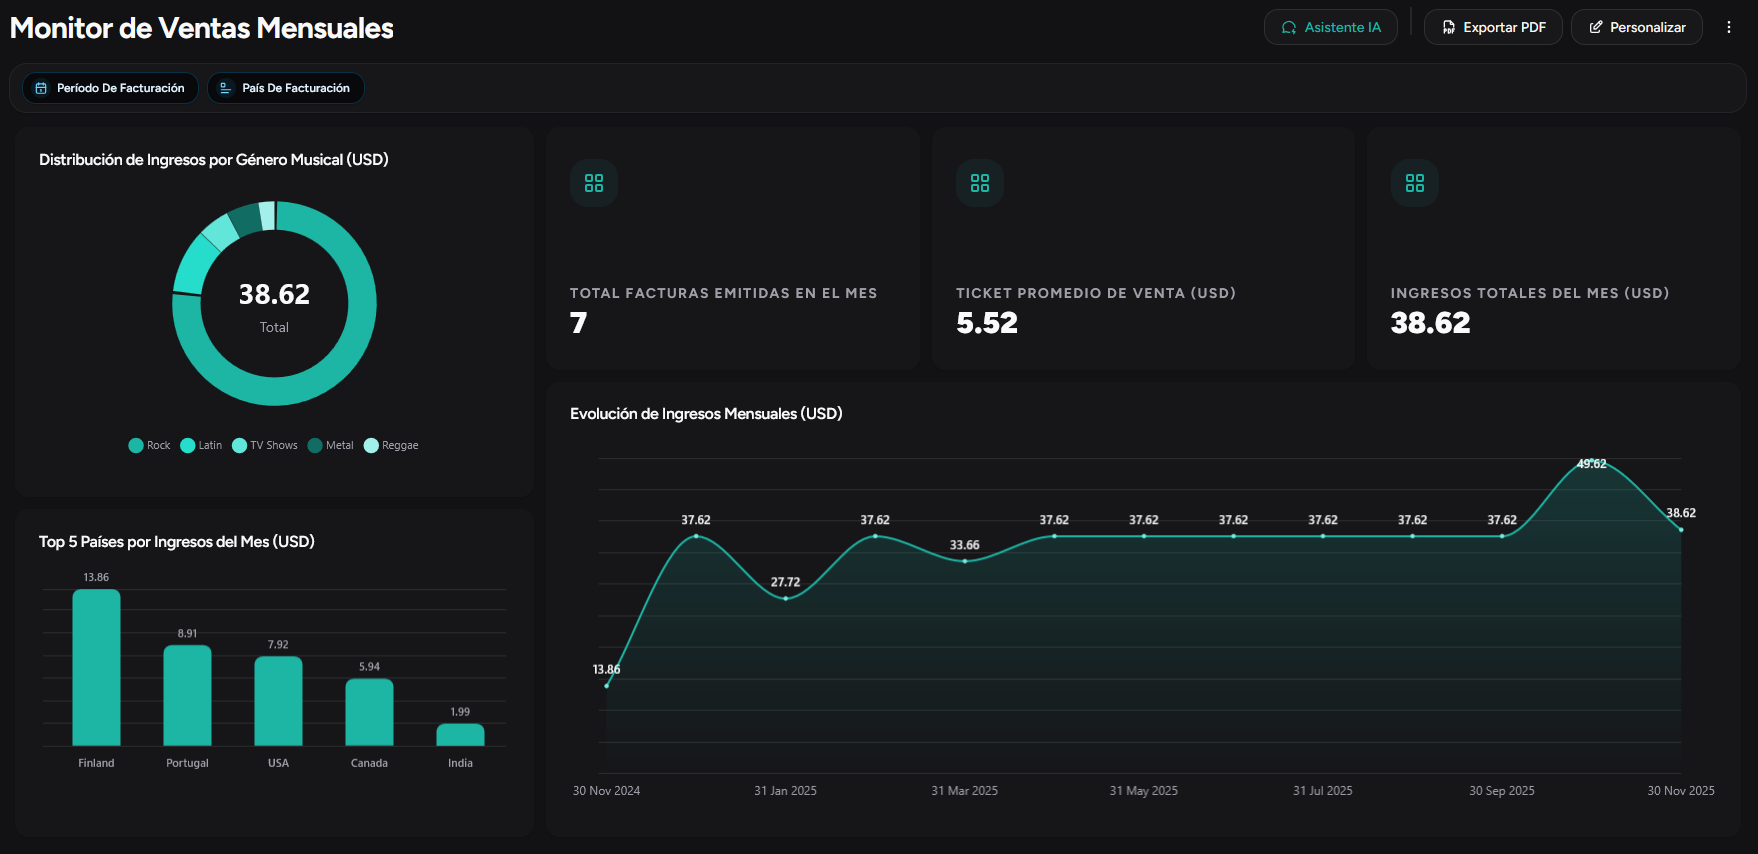
You don't need to be a data analyst to have a professional dashboard. With RapidBoard's AI Dashboard Builder, KapIA analyzes your data source and generates a complete panel with KPIs, charts, and SQL queries in minutes.
The 5 steps
Connect a data source
Choose the database, spreadsheet, or integration you want to analyze. The source must have business context configured ("Ready" status). KapIA will explore the schema to suggest smart metrics.
Choose the workspace
Select where the dashboard will be saved. Workspaces organize your panels by project, team, or area.
Select business areas
Indicate which departments you want to monitor: sales, operations, finance, engineering. This personalizes the indicators KapIA will generate.
Define name and objective
Give the dashboard a clear name and describe what decisions you want to make with it. Example: "Executive Sales Dashboard" — "Monitor monthly goal attainment, identify growth trends, and detect stalled opportunities in the pipeline". The more specific the objective, the better widgets AI generates.
KapIA generates your dashboard
The system analyzes your business context, data schema, and objective. It generates KPIs, charts, filters, and customized SQL queries. You receive a notification when it's ready.
What you get
- Complete dashboard with widgets relevant to your business
- Optimized SQL queries for each visualization
- Filters configured per tab
- Ready to share with your team
It's not a generic template: it's a dashboard built from how your company operates.
The process usually takes a few minutes. You receive a notification when the panel is ready and can adjust it from the visual editor.
Ready to see your metrics in a dashboard?
Join early access and connect your data in minutes—no SQL or manual reports.