BASIC GUIDE
Dashboard filters: one click to change the entire view
A static dashboard shows the same numbers always. A dashboard with filters adapts to the question of the moment: "How was Q1?" "North region only?" "This salesperson?"
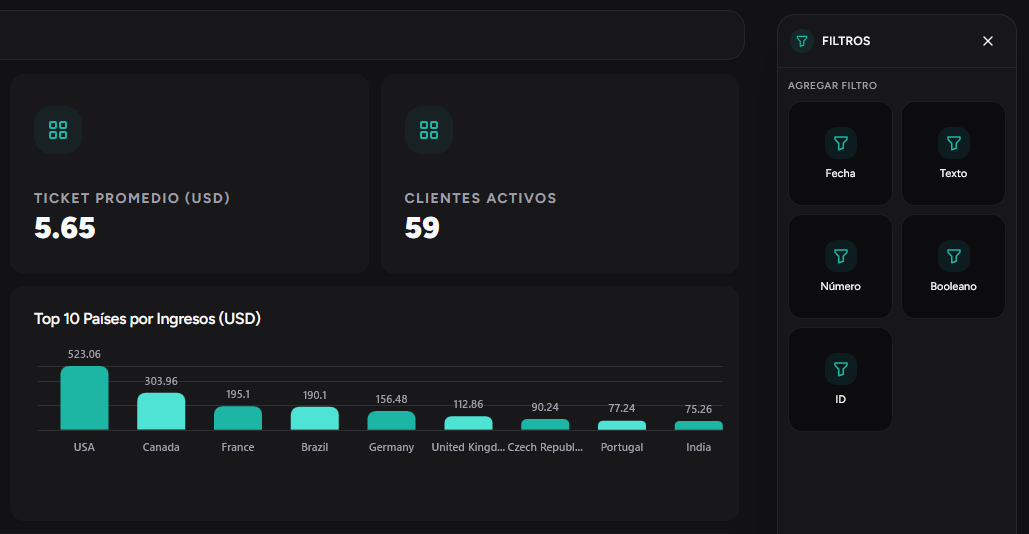
What global filters are
They are controls at the top of the dashboard that affect all widgets on a tab at the same time. You change one filter and all charts, KPIs, and tables update together.
Use cases in meetings
- Sales meeting: filter by quarter and region to see goal attainment
- Operations review: filter by date and team to detect bottlenecks
- Leadership committee: switch between tabs (sales, operations, finance) with independent filters
Dashboard with tabs
Organize your panel in tabs by area. Each tab has its own filters and widgets. That way a single dashboard serves different meetings without creating separate reports.
Filter types
| Filter | What it's for / Example |
|---|---|
| Date | Narrow a period — last month, Q1 2026, custom range |
| Text | Filter by category — region, product, salesperson |
| Number | Numeric ranges — amount greater than X, quantity between Y and Z |
| Yes/No | Boolean conditions — active customers only, urgent orders only |
| ID | Specific selection — one customer, one order, one project |
rapidboard.app
Ready to see your metrics in a dashboard?
Join early access and connect your data in minutes—no SQL or manual reports.