USE CASE
Engineering metrics with GitHub and Jira
Development teams generate valuable data every day: pull requests, code reviews, issues, sprints. But that information usually stays trapped in the tools, invisible to those who need to make decisions about capacity, quality, and velocity.
Why connect GitHub and Jira
- The data already exists: no need to load it manually
- It syncs automatically
- It lets you measure team productivity, quality, and workflow
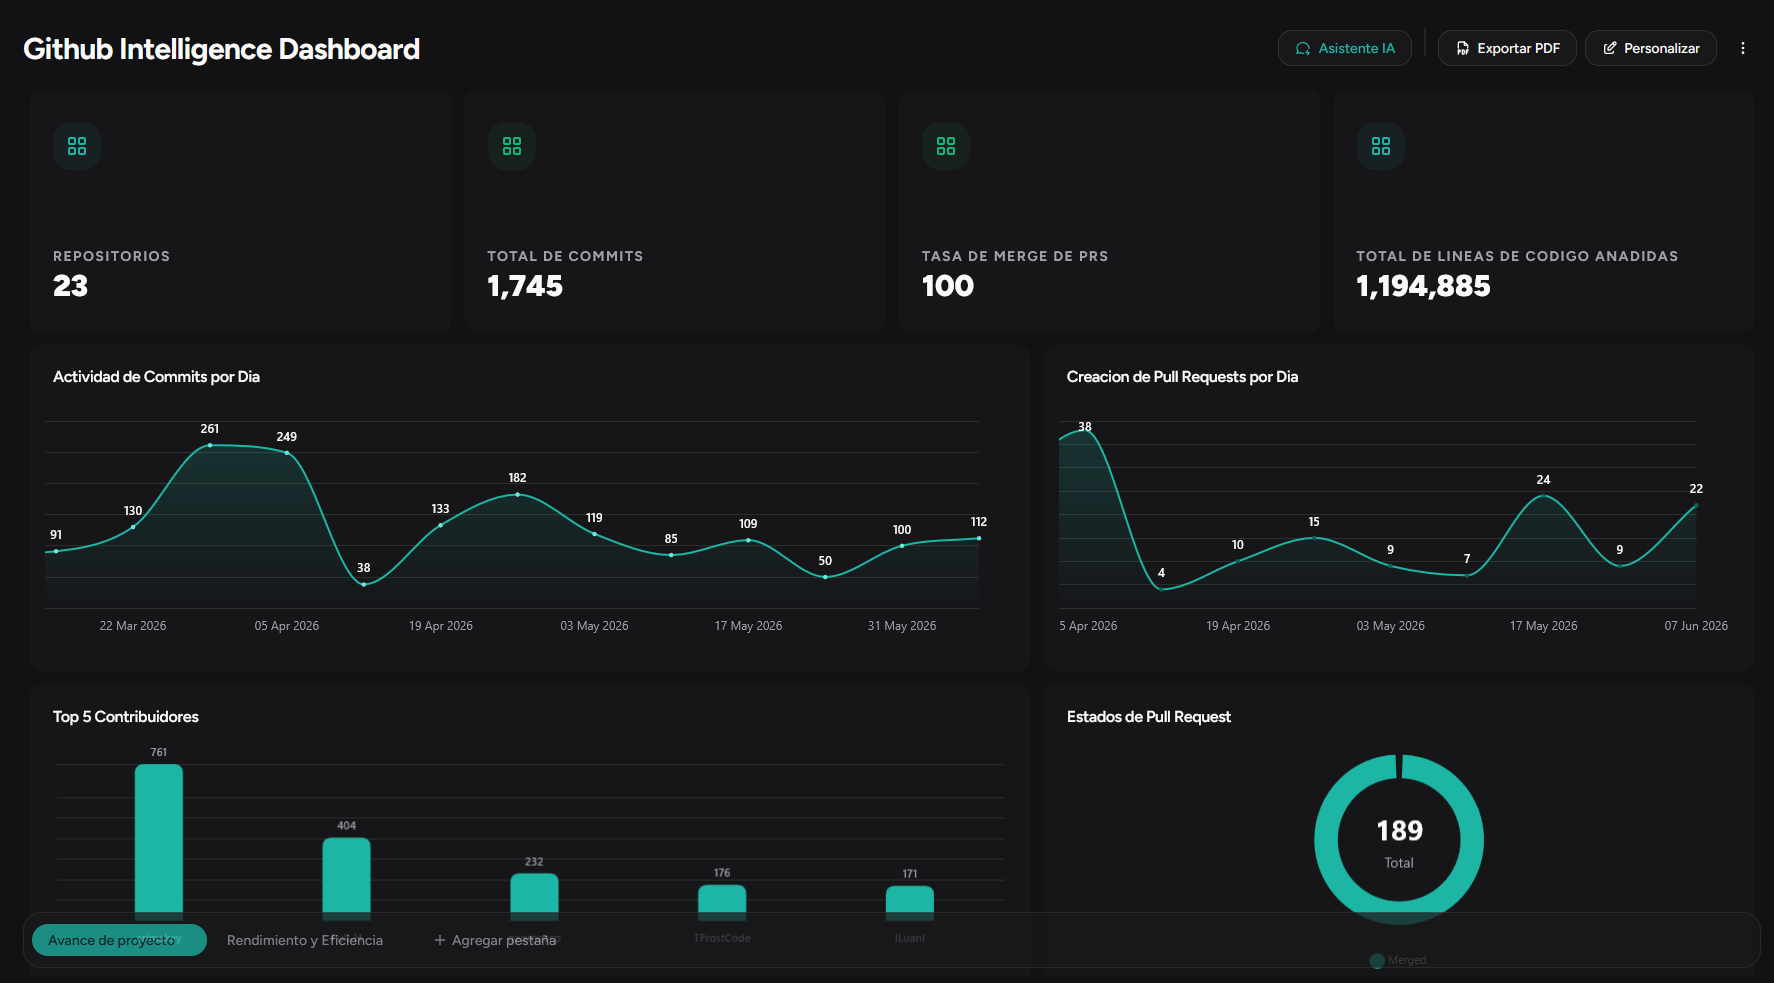
Example engineering dashboard
General tab
Monthly PR KPIs, open issues, current sprint velocity
Code Review tab
Average review time, pending PRs by reviewer, table of stalled PRs
Quality tab
Bugs per sprint, reopened issues, distribution by priority
Key engineering KPIs
| KPI | What it measures / Why it matters |
|---|---|
| PR review time | How long a PR takes to be approved — detects bottlenecks in code review |
| Merged vs open PRs | Team workflow — indicates if the team closes what it opens |
| Open vs closed issues | Backlog and resolution capacity — alerts about technical debt accumulation |
| Sprint velocity | Story points or completed tasks — capacity planning |
| Code churn | Modified vs added lines — indicates refactoring vs new development |
Ready to see your metrics in a dashboard?
Join early access and connect your data in minutes—no SQL or manual reports.