BASIC GUIDE
What is a data source and why does connecting it well matter?
Every number on a dashboard comes from somewhere. That place is the data source: the base from which metrics are extracted, transformed, and displayed.
Without a connected source, a dashboard is just an empty screen.
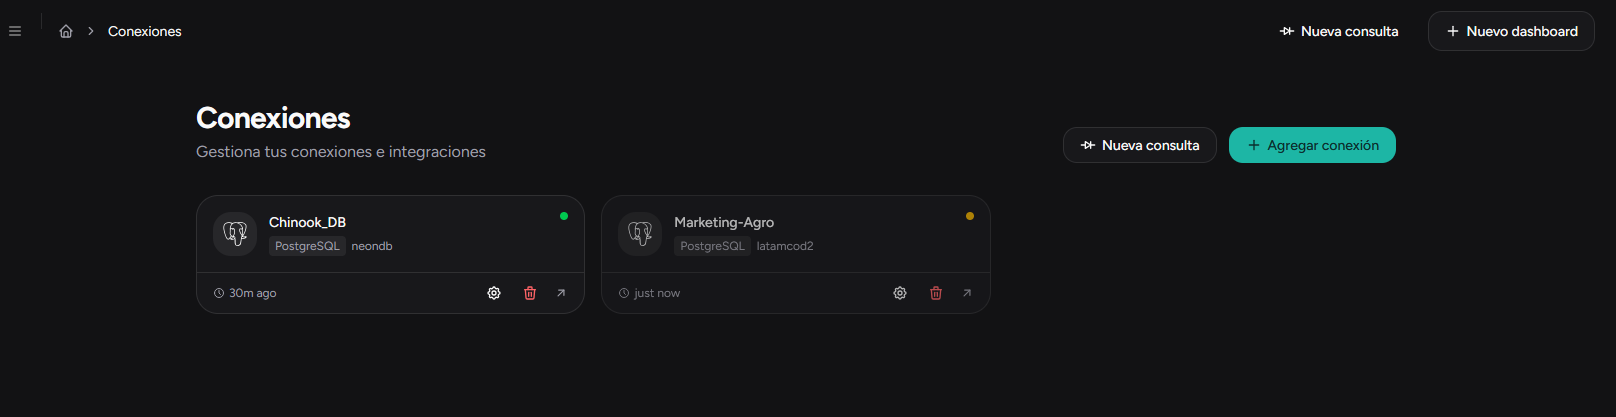
Common source types
| Source | What it contains / Example use |
|---|---|
| Spreadsheets (Google Sheets) | Day-to-day operational data — sales, inventory, expenses |
| CRM | Customers, opportunities, pipeline — sales dashboard |
| Database (PostgreSQL, MySQL) | Structured business data — ERP, proprietary system |
| Team tools (GitHub, Jira) | Issues, PRs, commits, sprints — engineering metrics |
| Files (CSV, Excel) | One-off exports — initial loads or historical data |
The problem of scattered data
When each area has its own sheet, its own CRM, or its own database, the numbers don't add up. Sales says X, finance says Y, operations says Z. A centralized dashboard connects those sources and shows a single version of the truth.
Live dashboard vs static report
An email report is a snapshot of a moment. A connected source feeds a dashboard that updates on its own: when data changes at the source, it changes on the panel.
Beyond connecting: teaching the system your business
Connecting the source is the first step. The second is configuring context: how your company defines a sale, what counts as an active customer, how you calculate churn. Without that context, any tool (including AI) will interpret the data generically.
Ready to see your metrics in a dashboard?
Join early access and connect your data in minutes—no SQL or manual reports.