PRACTICAL GUIDE
Automated PDF reports with business narrative
Exporting a dashboard to PDF shouldn't be just a screenshot. A good report explains what happened, why it matters, and what to do about it.
Beyond chart screenshots
A PDF report in RapidBoard includes:
- The dashboard charts and KPIs
- An AI-generated narrative that interprets the data
- Business context: not just numbers, but what they mean
- Format ready to share with leadership, investors, or clients
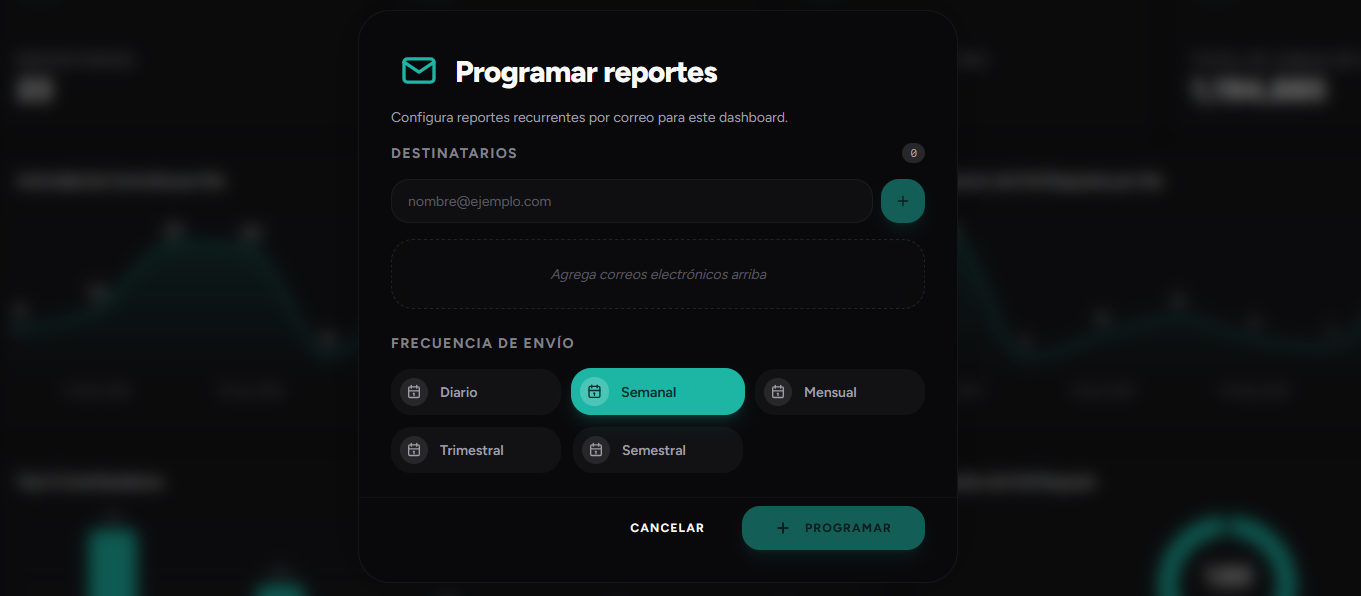
Automatic scheduling
Configure frequency and recipients:
- Weekly sales report → every Monday at 8:00
- Monthly operations summary → first day of the month
- Engineering dashboard → every Friday to the technical team
The team receives the report without anyone having to build it manually.
When to use scheduled reports vs live dashboard
| PDF report | Live dashboard |
|---|---|
| Periodic summary for those who don't log into the platform | Daily check for the operations team |
| Leadership committee, investors | Managers and analysts |
| Historical archive of how numbers looked | Decision in the moment |
Ready to see your metrics in a dashboard?
Join early access and connect your data in minutes—no SQL or manual reports.