BASIC GUIDE
What is a dashboard?
A dashboard is a visual panel that brings your company's most important metrics into one place. Instead of digging through scattered spreadsheets, you see sales, operations, or finance updated and ready for decisions.
It's not a static report you email around: it's a live view that updates when your data changes. It answers instantly whether you're on track, where the bottleneck is, and which area needs attention.
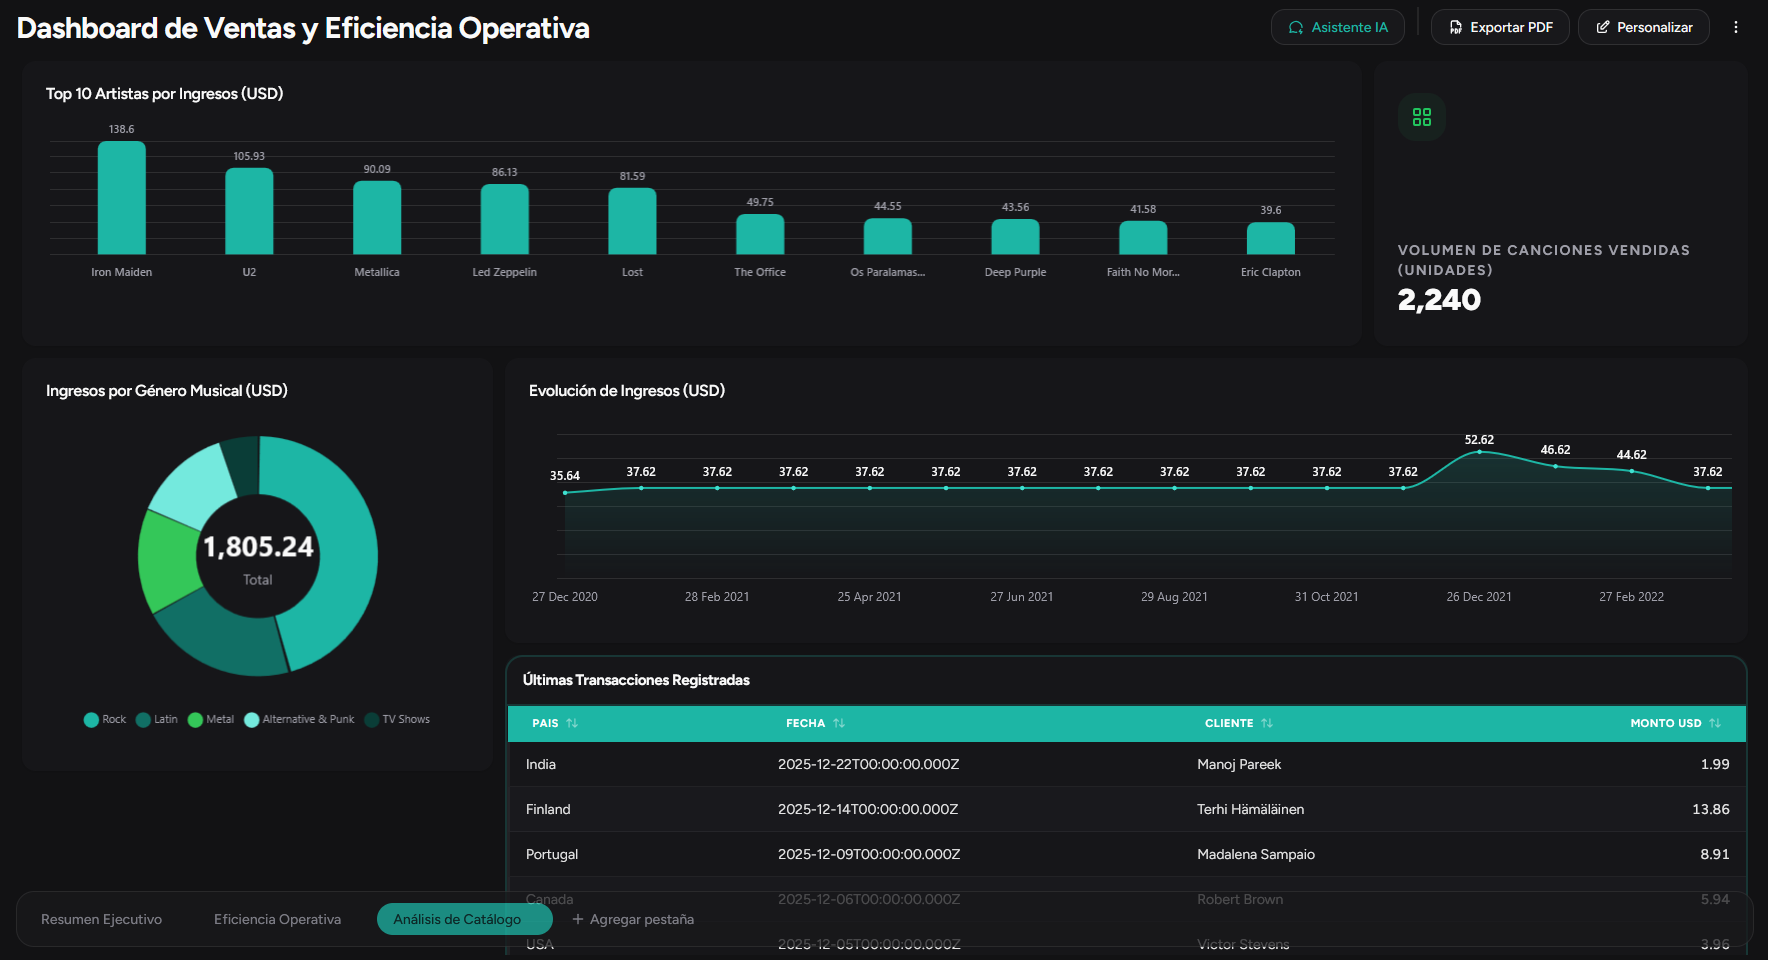
What a dashboard is for
- Centralize sales, operations, and finance KPIs on a single screen
- Cut hours spent consolidating manual Excel reports
- Give managers and teams visibility without depending on analysts
- Spot deviations early with up-to-date metrics
- Align the team on the same numbers, not different versions of the report
Dashboard examples
Each area of the business usually has its own panel with the metrics that matter most.
Sales dashboard
Pipeline, conversion, average deal size, and quota attainment. Ideal for sales managers who still build reports by hand.
Operations dashboard
Delivery, inventory, cycle time, and efficiency indicators. Helps spot bottlenecks before they affect customers.
Financial / executive dashboard
Revenue, margins, cash flow, and month-over-month comparisons. Gives leadership a clear picture without waiting for late closes.
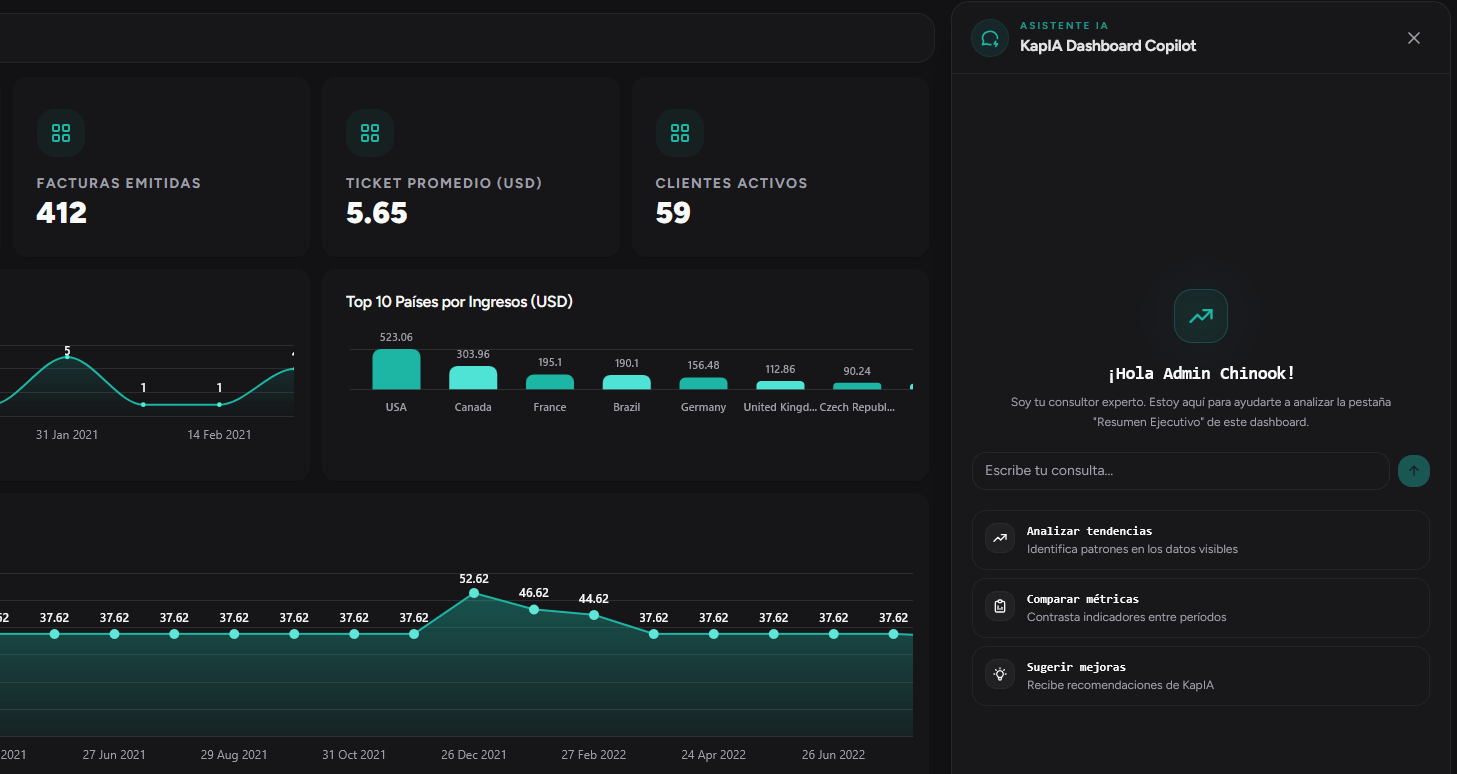
From manual Excel to an automated dashboard
Many teams start by consolidating data by hand. A well-configured dashboard removes that repetitive step.
Connect your sources
Sheets, databases, or CRM. Your data flows into the panel on its own.
Define what metrics matter
Choose the KPIs your team actually uses to decide — not dozens of decorative charts.
Share and automate
The team checks the dashboard when needed; reports send themselves if you set them up.
FREQUENTLY ASKED QUESTIONS
We answer your questions
Ready to see your metrics in a dashboard?
Join early access and connect your data in minutes—no SQL or manual reports.