From manual Excel to automatic dashboard
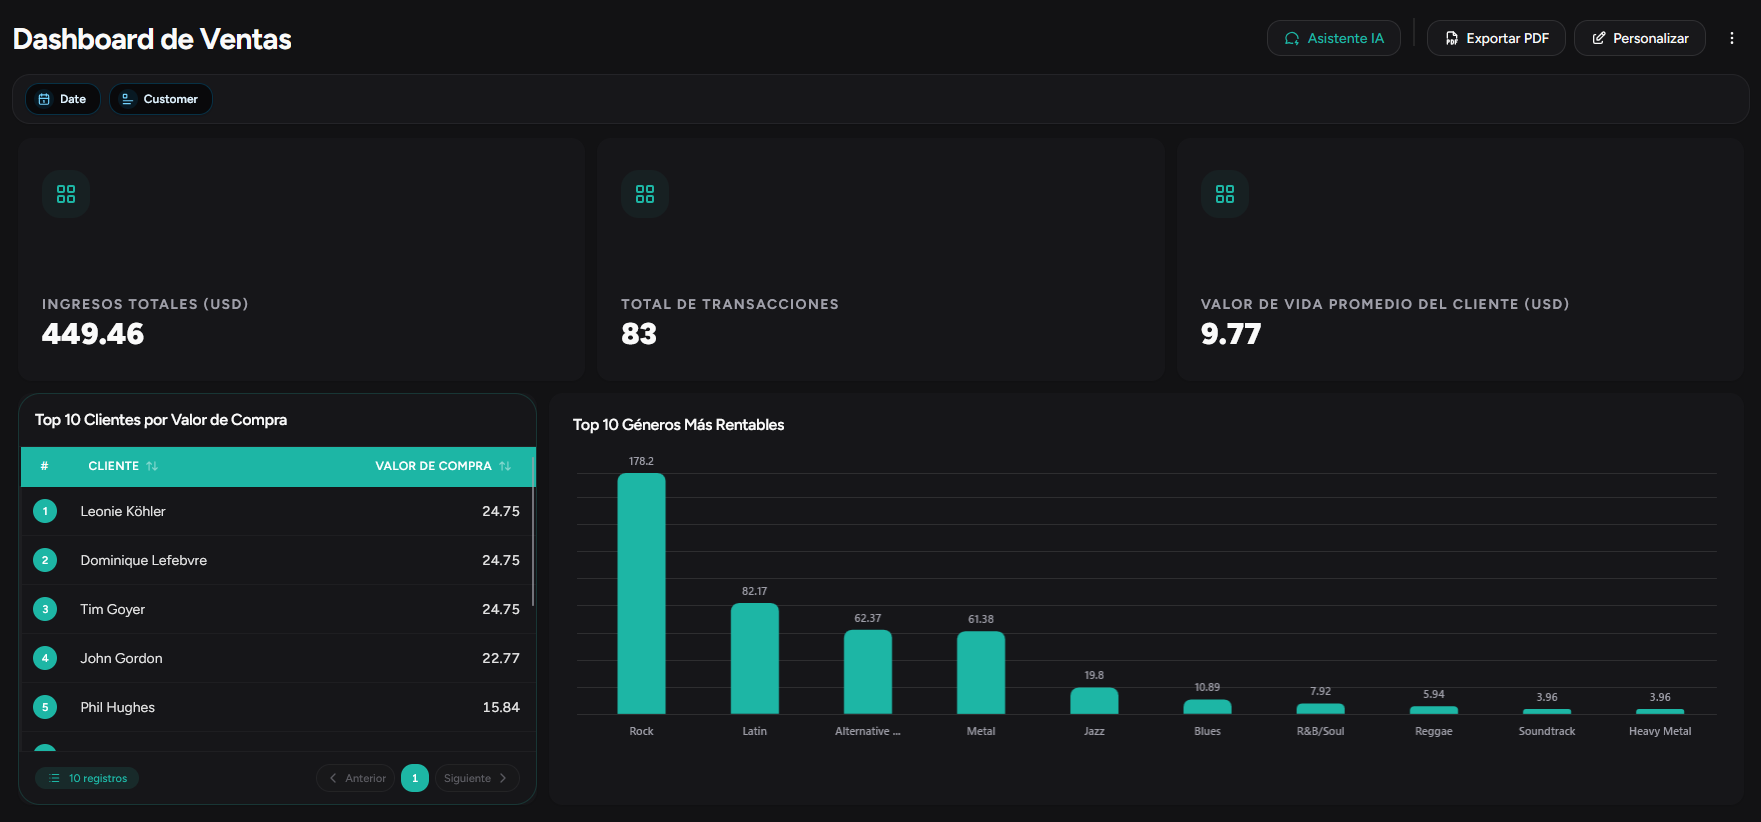
If your team spends hours every week consolidating spreadsheets, copying data between files, and sending reports by email, you're not analyzing; you're managing data. That time should go to interpreting and deciding.
Why Excel fails as a reporting system
- Everyone has their own version of the file
- Data goes stale as soon as someone exports
- Manual consolidation introduces errors
- There’s no real-time visibility for the team
- Depending on one person who “knows how to build the report” is an operational risk
Signs you need a dashboard
- More than one person consolidates the same report
- Monday’s numbers don’t match Friday’s
- Managers ask for “the updated version” by email
- Nobody knows if the data is from yesterday or last week
The 3 phases of change
01 — Connect your sources Sheets, databases, CRM, or tools like GitHub and Jira. Your data flows on its own to the panel without copy and paste. In RapidBoard you connect the source once and it stays synced.
02 — Define which metrics matter Choose the KPIs your team actually uses to decide. Not dozens of decorative charts: 4–6 actionable metrics per area. If you have business context configured, the AI understands how your company defines “completed sale” or “active customer”.
03 — Share and automate The team checks the dashboard when they need it. Reports send themselves if you configure them. No emails with outdated attachments.
When is Excel still useful?
Excel is excellent for ad-hoc analysis, financial modeling, or individual work. It stops being the right tool when it becomes the team’s reporting system.
Get started today with
RapidBoard for your team
Early access is open. Join the first 100 spots and start making data-driven decisions faster.