RapidBoard Blog
Clear guides on dashboards, KPIs, and analytics for business teams. No technical jargon — content written by RapidBoard founders to help you make better data-driven decisions.
GUIDES & ARTICLES
Start with the essentials
Core concepts on dashboards, KPIs, charts, data sources, and filters before you build your first panel.
BASIC GUIDE
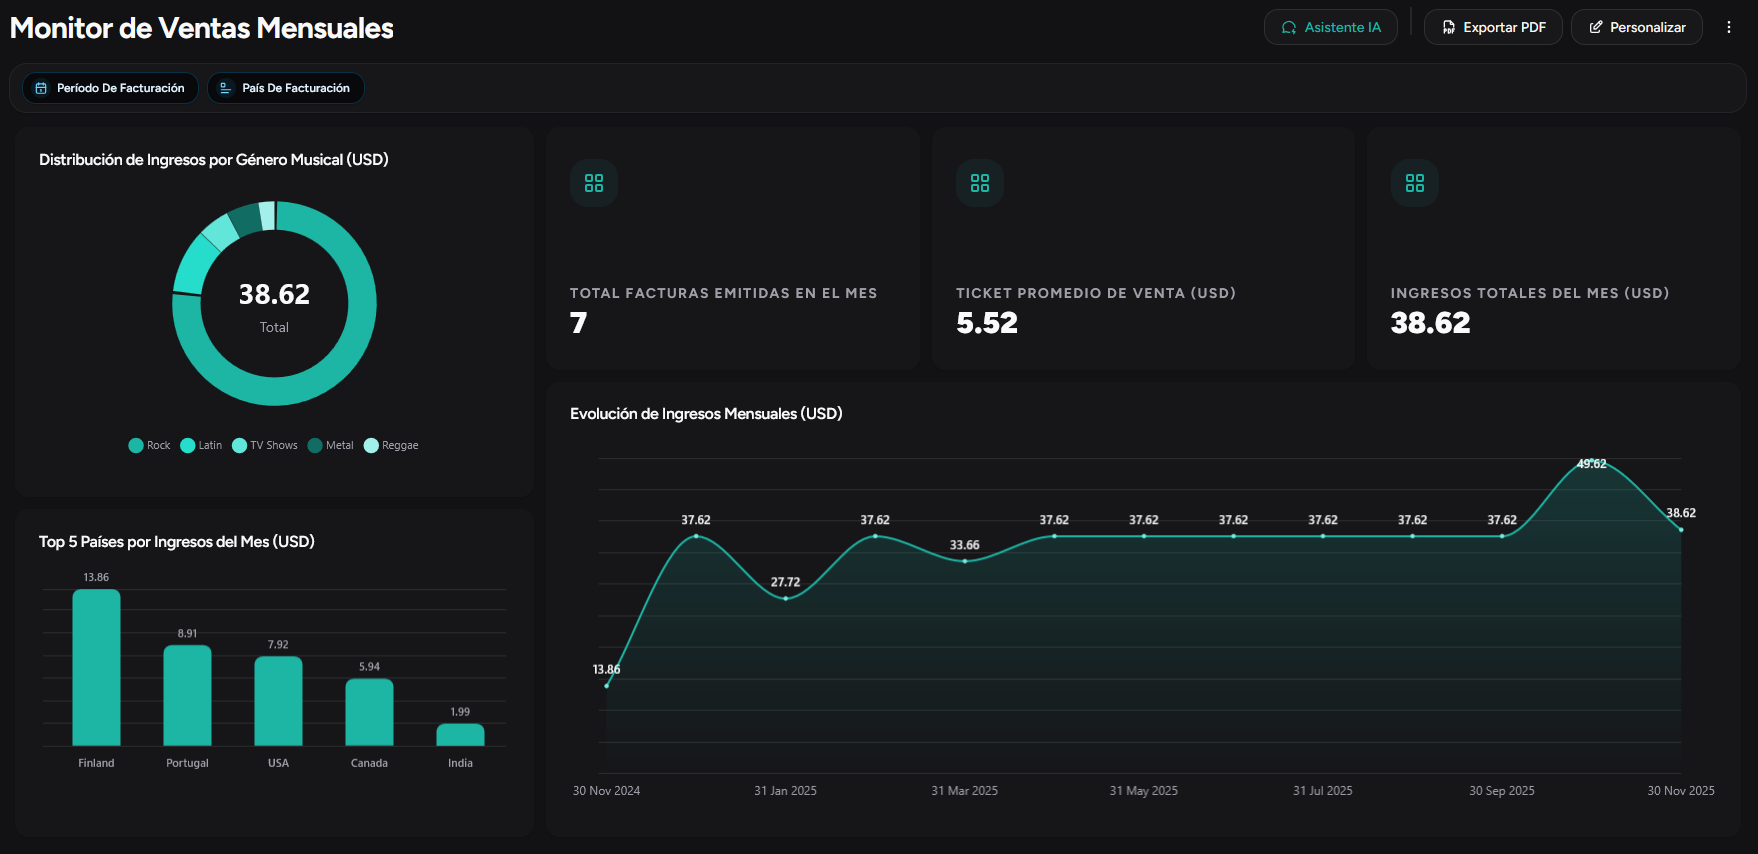
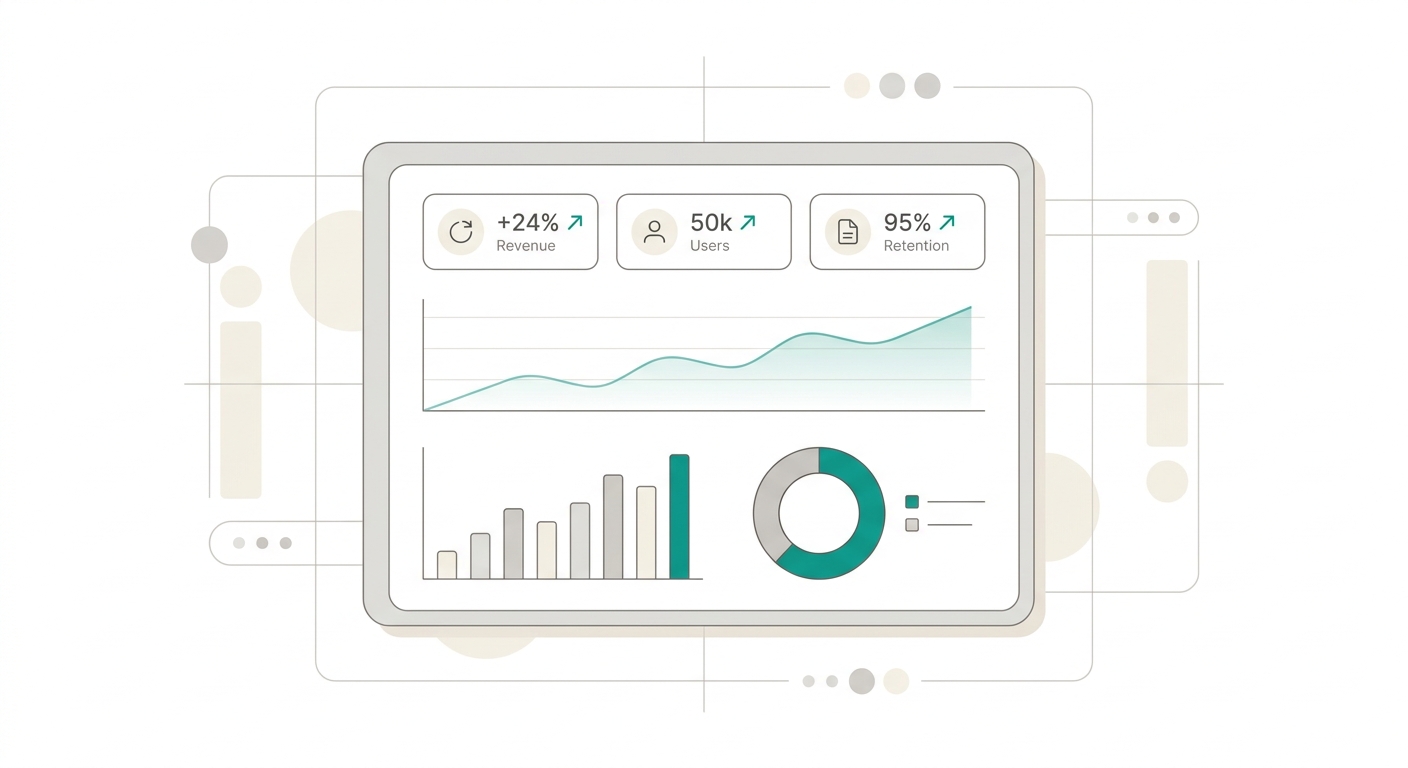
What is a dashboard?
Learn what a dashboard is, what it's for, and examples by area (sales, operations, finance). A clear guide for managers and non-technical teams.
Read guide
BASIC GUIDE
What is a KPI?
What a KPI is, examples by area, and important sales KPIs. A practical guide for managers who want to measure what matters.
Read guide
BASIC GUIDE
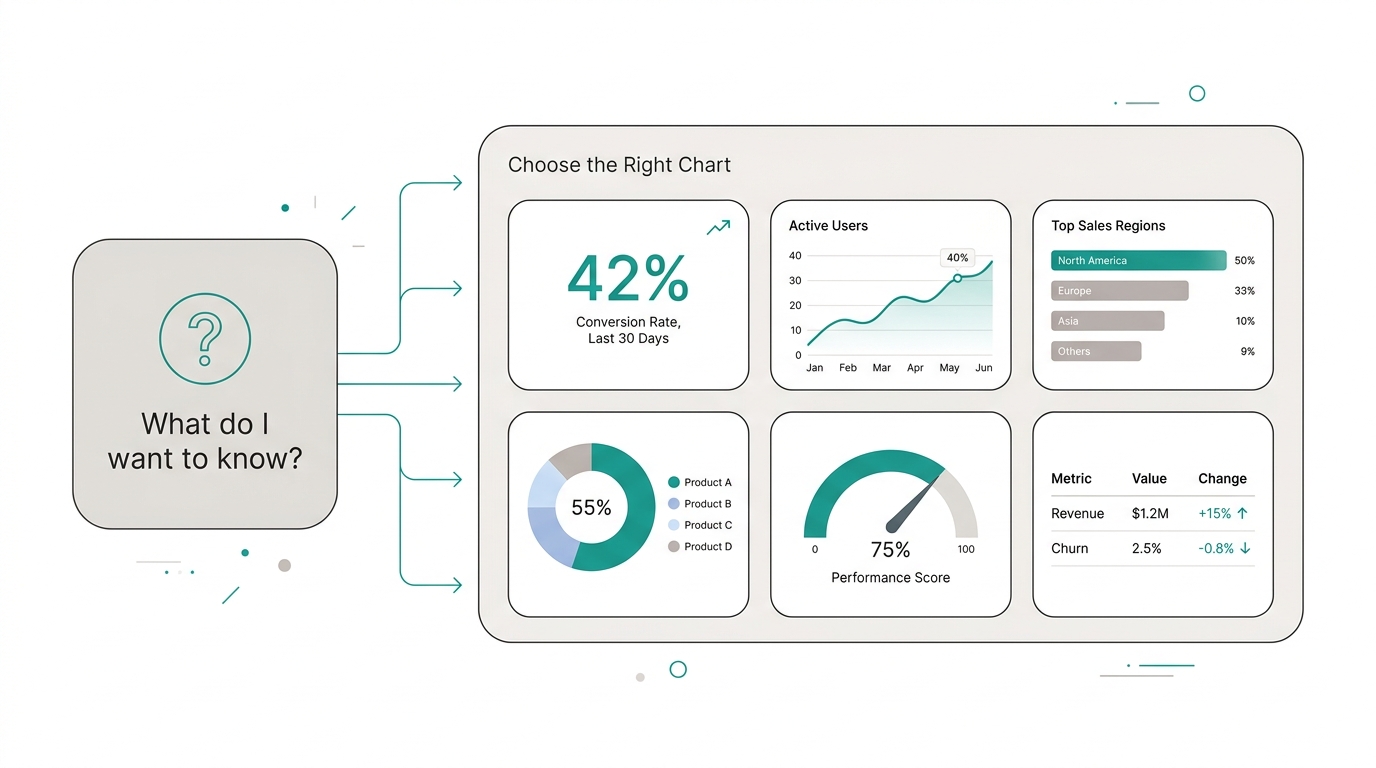
Which chart type to use for your business question
A dashboard isn't about filling the screen with charts. It's about answering questions with the right visualization.
Read guide
BASIC GUIDE
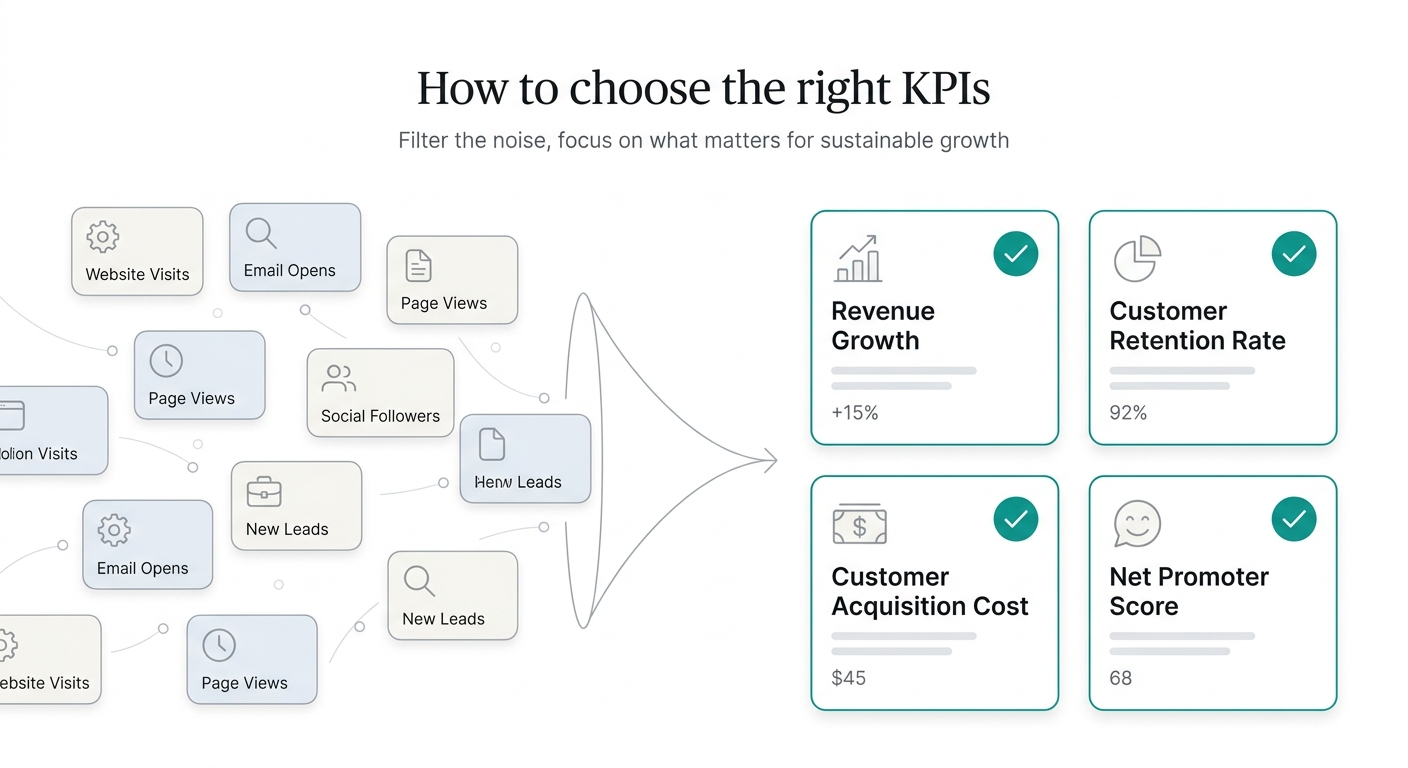
How to choose the right KPIs for your team
Knowing what a KPI is is the first step. The second (and harder) one is choosing which ones to use without overwhelming your panel.
Read guide
BASIC GUIDE
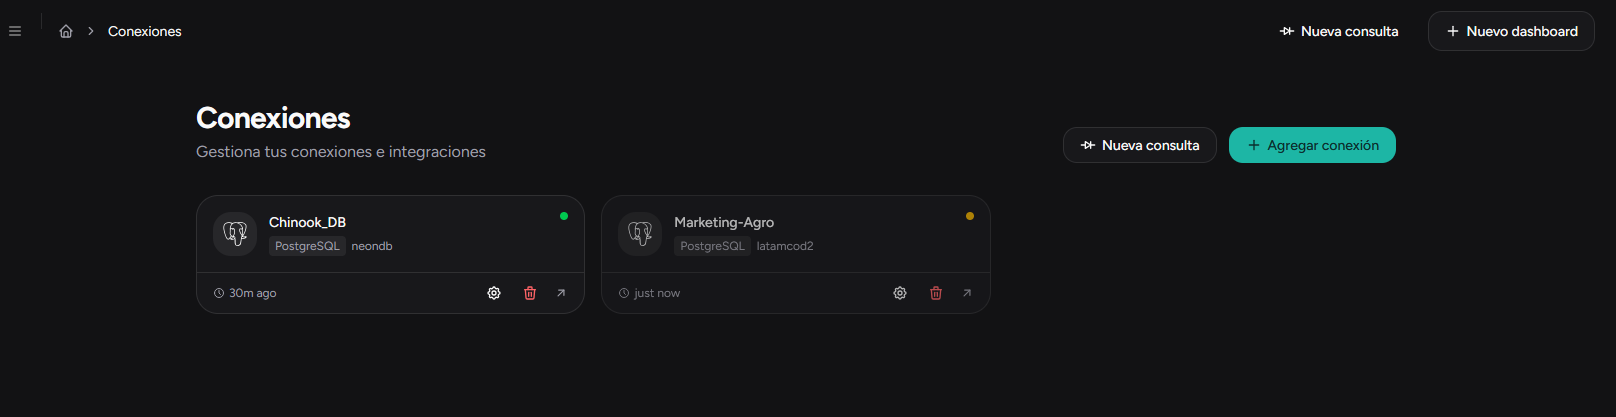
What is a data source and why does connecting it well matter?
Every number on a dashboard comes from somewhere. Without a connected source, a dashboard is just an empty screen.
Read guide
BASIC GUIDE
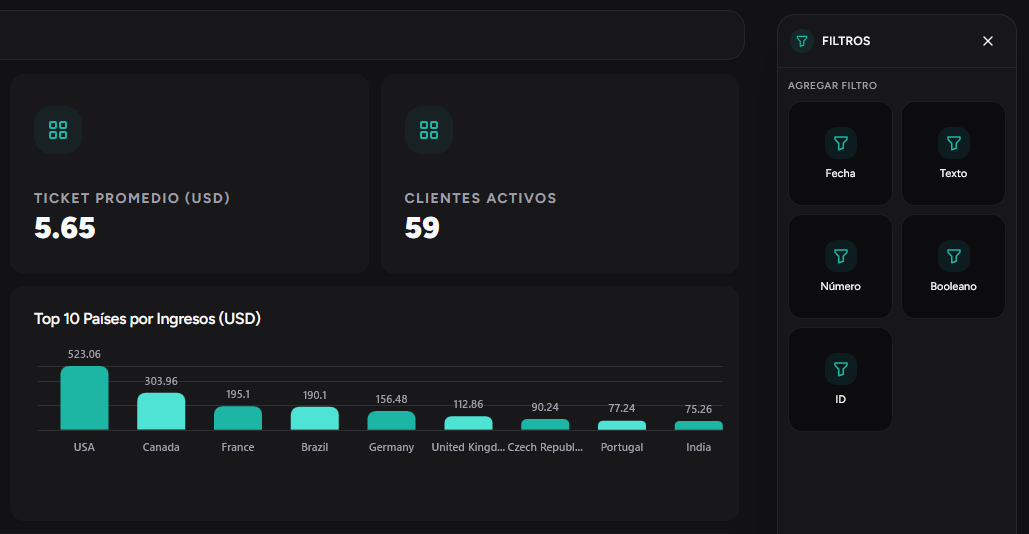
Dashboard filters: one click to change the entire view
A dashboard with filters adapts to the question of the moment: "How was Q1?" "North region only?"
Read guideBuild your dashboard
Move from Excel to a live panel, teach business context to AI, and create dashboards with KapIA or conversational analytics.
PRACTICAL GUIDE
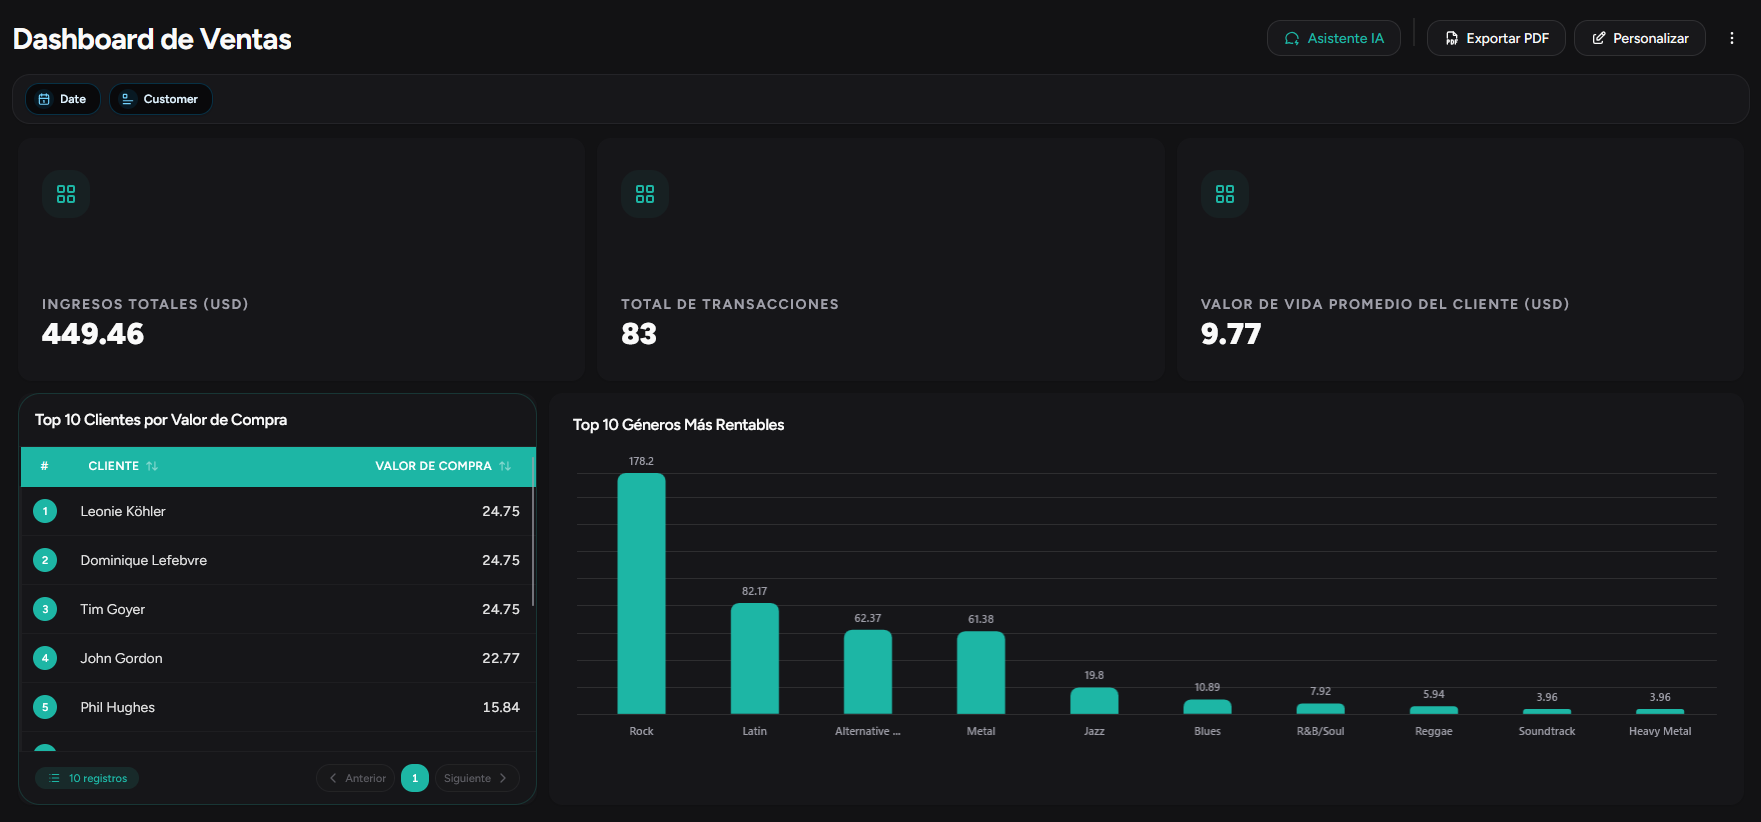
From manual Excel to automatic dashboard
If your team spends hours consolidating spreadsheets, you're not analyzing; you're managing data.
Read guide
PRACTICAL GUIDE
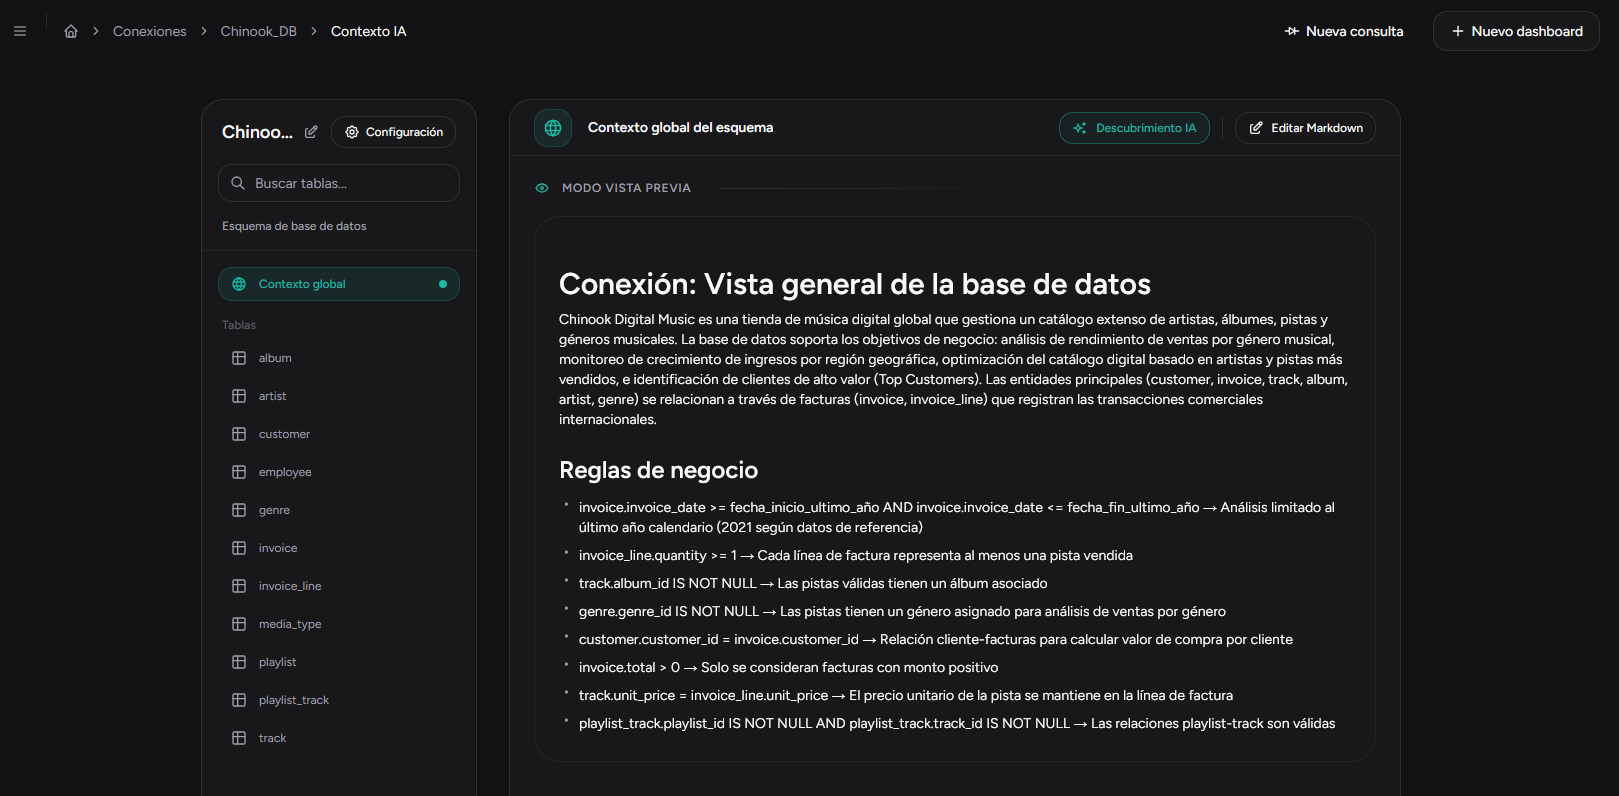
How to teach AI your business rules (without writing SQL)
Two companies can have a table called "sales" and mean completely different things. AI needs to know your rules.
Read guide
PRACTICAL GUIDE
Build your first AI dashboard in 5 steps
You don't need to be a data analyst to have a professional dashboard. KapIA generates a complete panel in minutes.
Read guide
PRACTICAL GUIDE
Conversational analytics: ask in plain English, get charts and answers
Imagine asking your data: "Who were the top 10 customers by sales this quarter?" and getting a chart instantly.
Read guideConnect and automate
Connect GitHub, Jira, or Google Sheets and stop consolidating data manually every week.
USE CASE
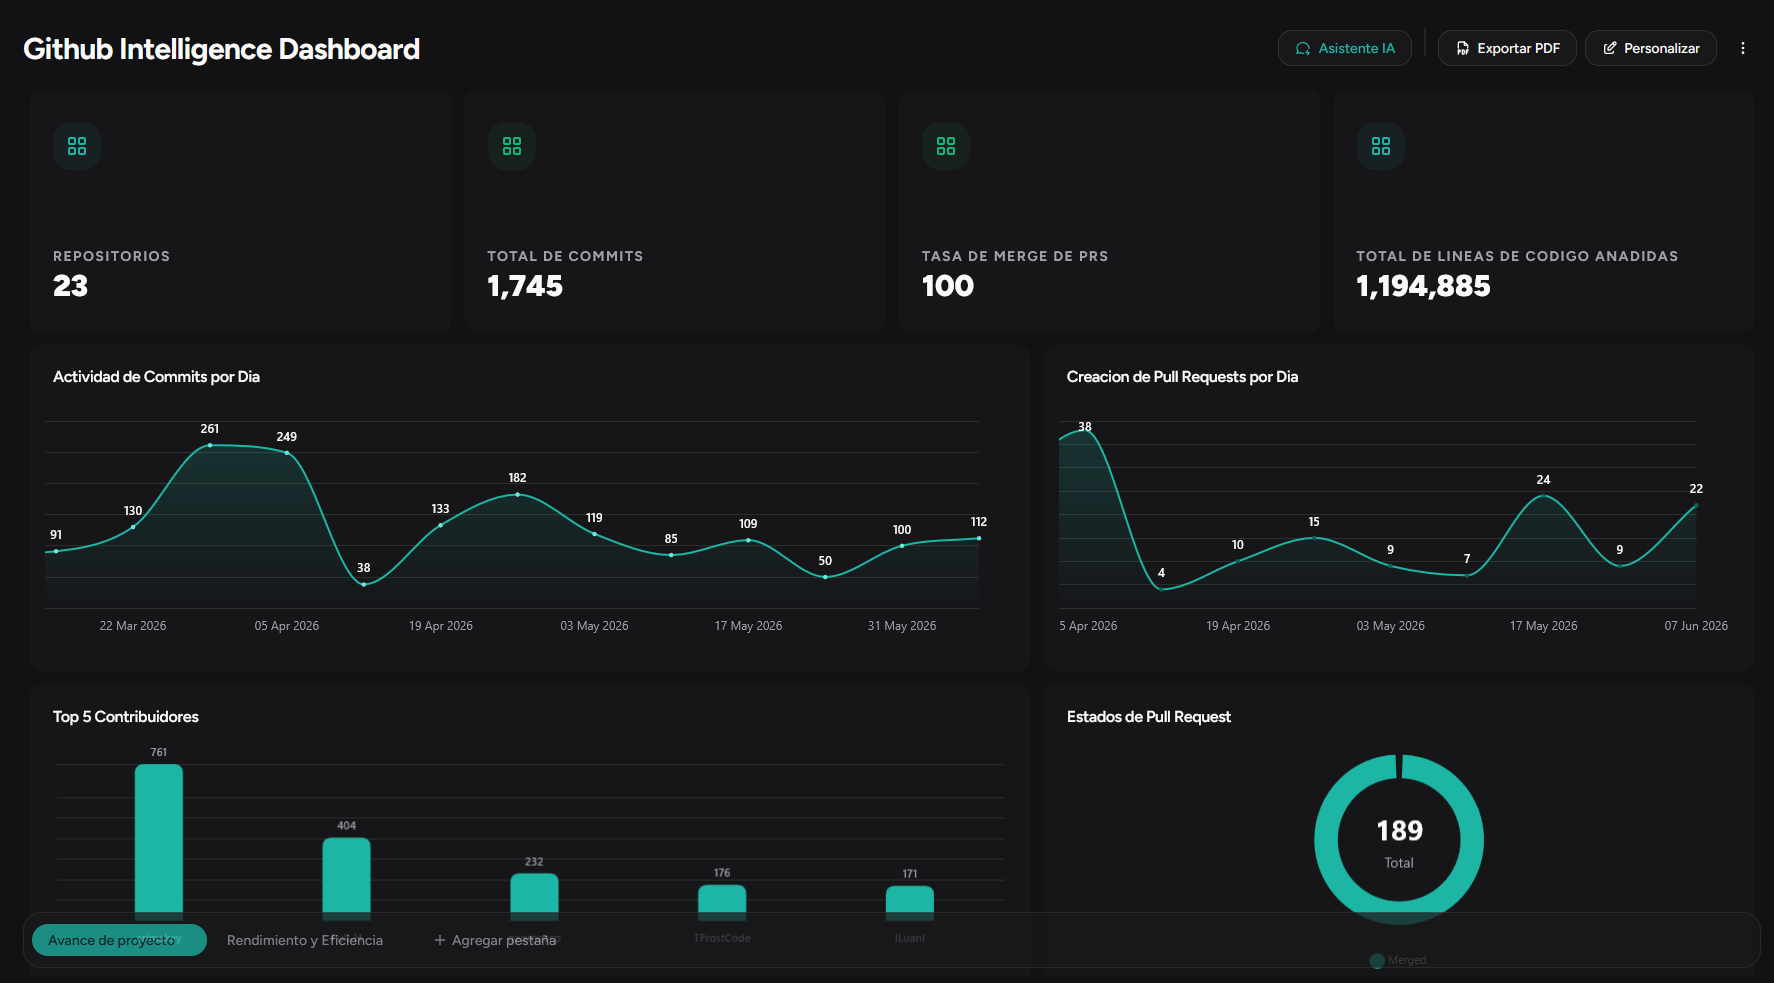
Engineering metrics with GitHub and Jira
Development teams generate valuable data every day, but it usually stays trapped in the tools.
Read guide
PRACTICAL GUIDE
Google Sheets as your source of truth (without copy-pasting every week)
Many SMBs live in Google Sheets. The problem starts when that sheet becomes the team's reporting system.
Read guideScale and share
Install ready-made templates, schedule PDF reports, and share metrics with your team without manual work.
PRACTICAL GUIDE
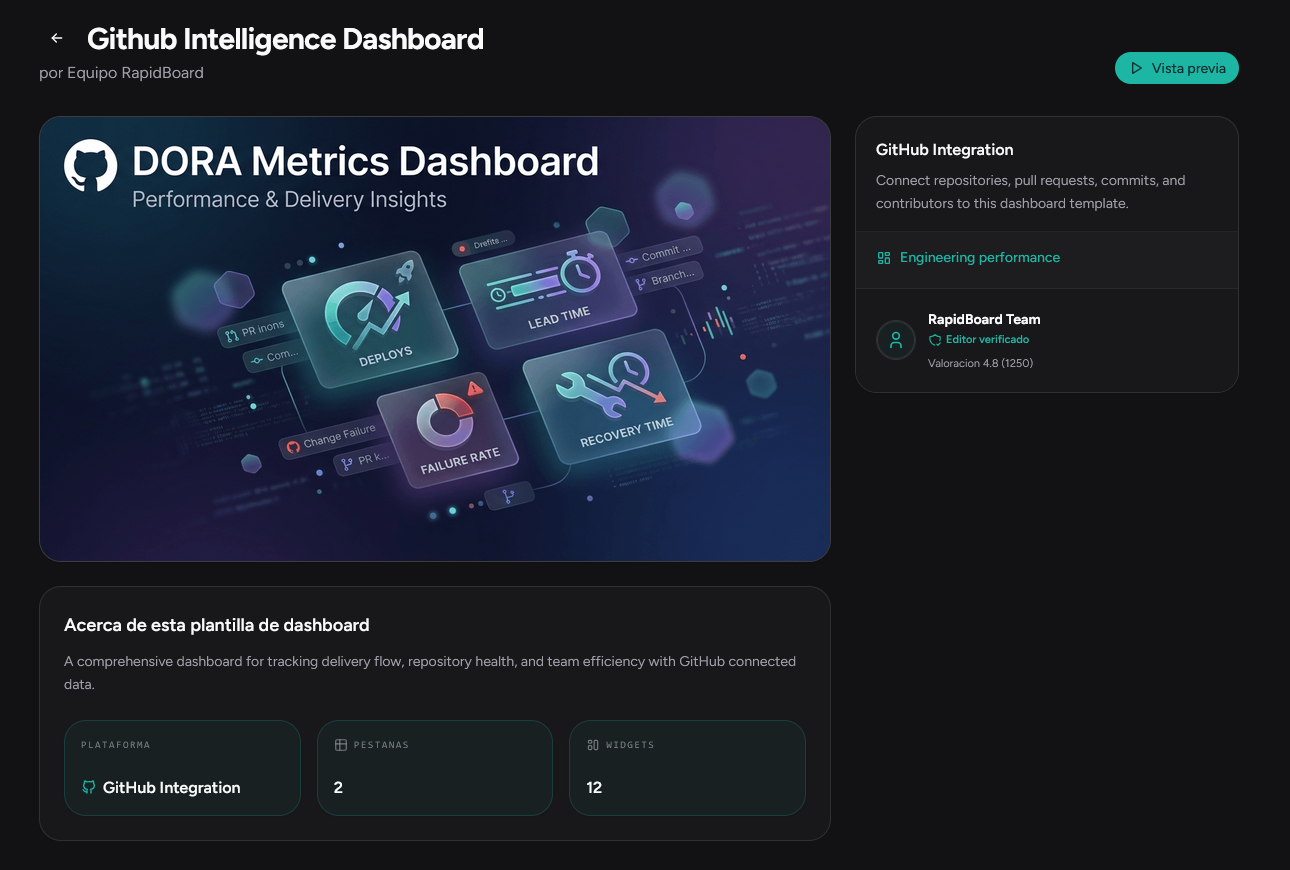
Ready-to-use templates: install a dashboard in minutes
You don't always have to start from scratch. The metrics you need may already be defined in a ready-to-install template.
Read guide
PRACTICAL GUIDE
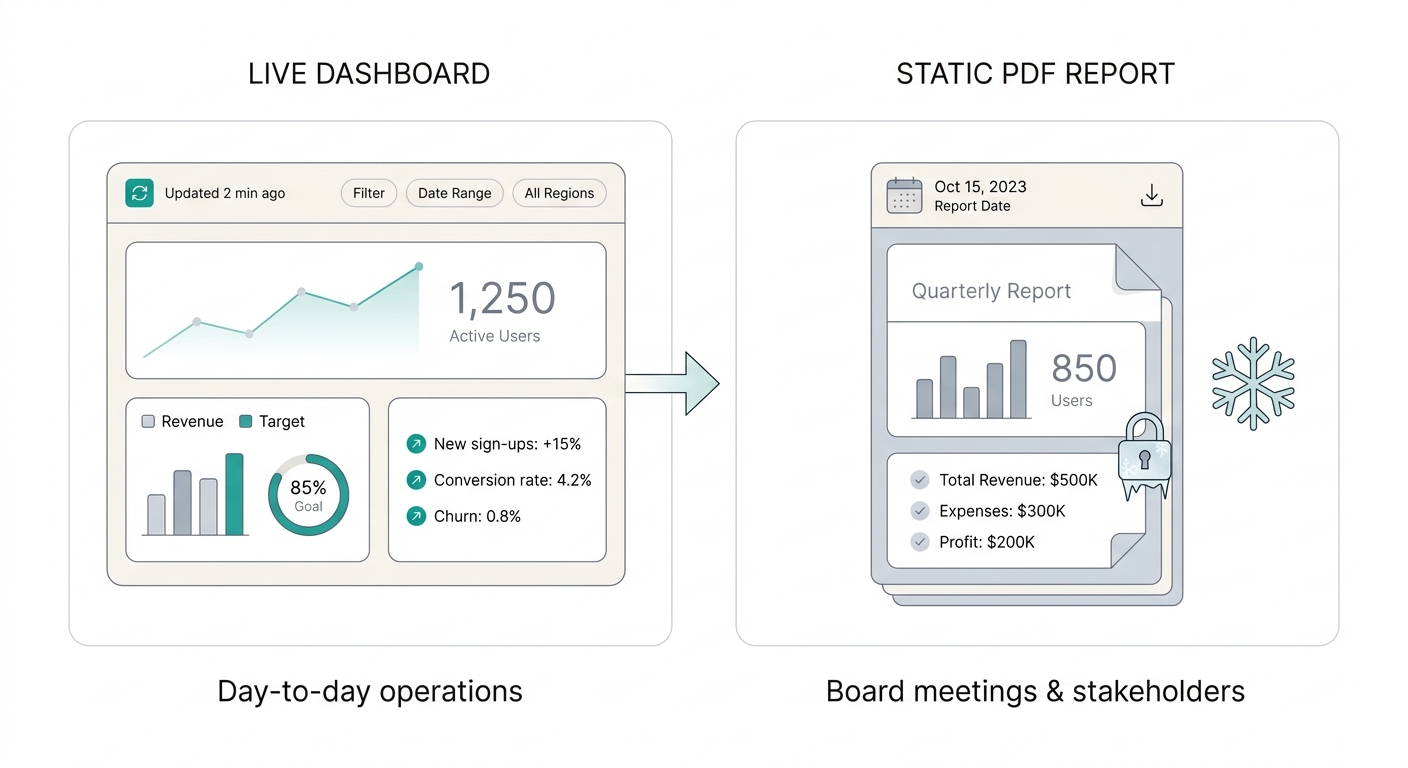
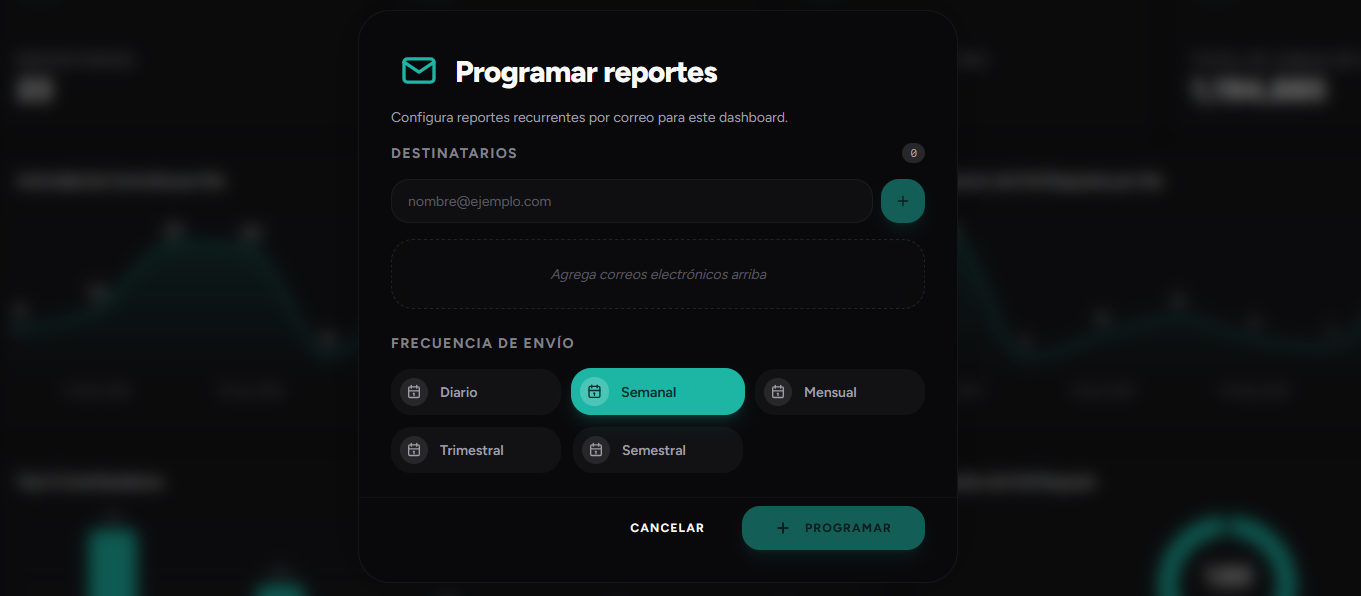
Automated PDF reports with business narrative
Exporting a dashboard to PDF shouldn't be just a screenshot. A good report explains what happened and what to do.
Read guide