What is a data source? (and why it matters)
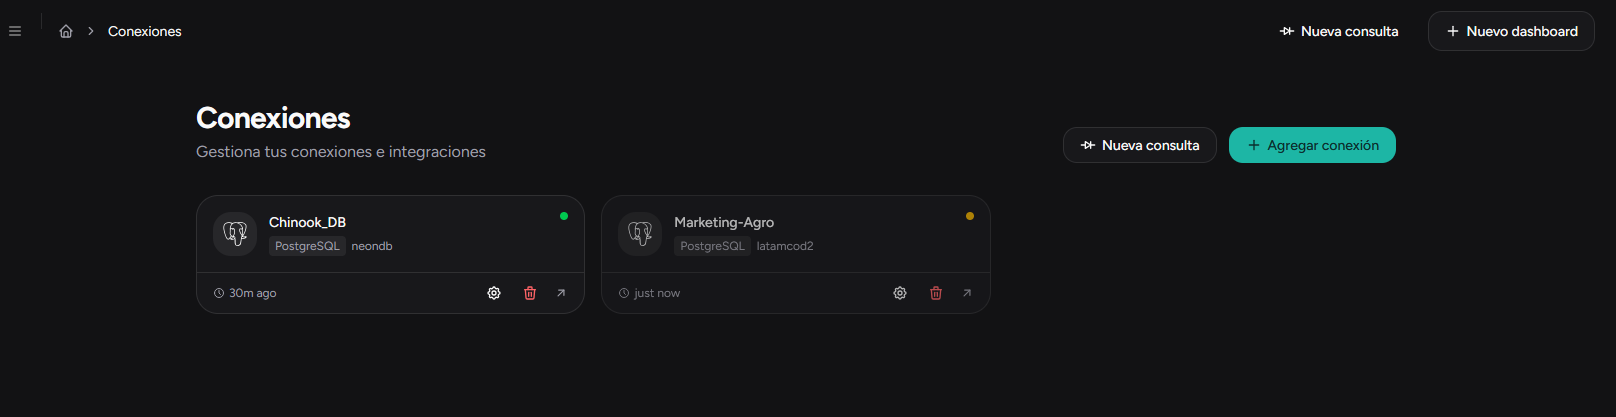
Every Monday at 8 a.m., someone on your team opens three spreadsheets, copies, pastes, tweaks formulas, and prays the numbers add up. Two hours later, they have a report that's already outdated. This weekly ritual costs companies thousands of hours a year — and worse, it produces decisions based on stale data.
The problem isn't a lack of data. It's that your data is scattered. Sales in a Google Sheet, pipeline in HubSpot, tickets in Jira. Each source has its own format, its own refresh cadence, and its own version of the truth.
Connecting those sources to a dashboard is what turns scattered data into decisions. Without connection, the prettiest dashboard in the world is an empty screen.
Where do your dashboard numbers come from?
A data source is the real origin of every number you see on a panel. It could be a Google Sheet with this month’s sales, a PostgreSQL database with your product catalog, a CRM like HubSpot with your open opportunities, or tools like GitHub with your sprint’s pull requests.
The dashboard doesn’t invent the data: it pulls it from the source and converts it into charts. If the source is outdated, the most precise KPI in the world will show wrong information.
What to check today: open your dashboard. For each KPI, ask yourself “where did this number come from?” If you can’t answer in under five seconds, you have a source problem.
The 5 types of sources that feed a dashboard
Each type of source solves a different need. Connecting Google Sheets isn’t the same as connecting a database: the difference is in how alive the information is.
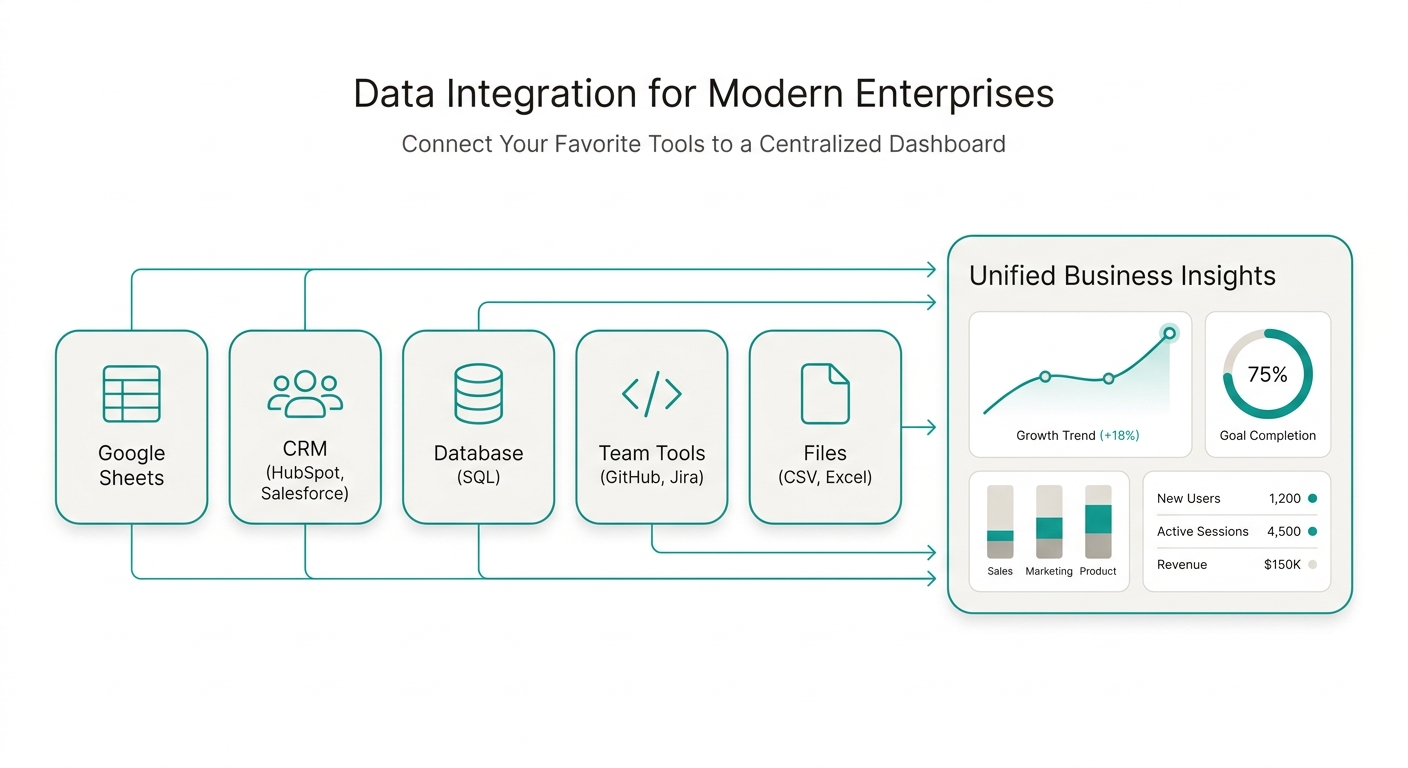
- Google Sheets — for day-to-day operational data: sales, inventory, expenses. What your team already updates manually.
- CRM (HubSpot, Salesforce) — customers, pipeline, opportunities. The engine of any sales dashboard.
- Database (PostgreSQL, MySQL) — structured data from the business core: ERP, proprietary system.
- Team tools (GitHub, Jira) — issues, PRs, commits, sprints. What engineering measures.
- Files (CSV, Excel) — one-off exports, initial loads, historical data.
You don’t need all five to get started. With a single connected source you already have a dashboard that updates on its own.
The scattered data problem (what it looks like in real life)
Maria is a sales manager. Her company sells through web, in-store, and distributors. Each channel uses its own spreadsheet. Every Monday Maria spends two hours copying and pasting numbers that never add up: web reports $52,000 in revenue, in-store $38,000, distributors $15,000. But when she adds them up, the total doesn’t match what accounting says. Some invoices are recorded in one system but not the other.
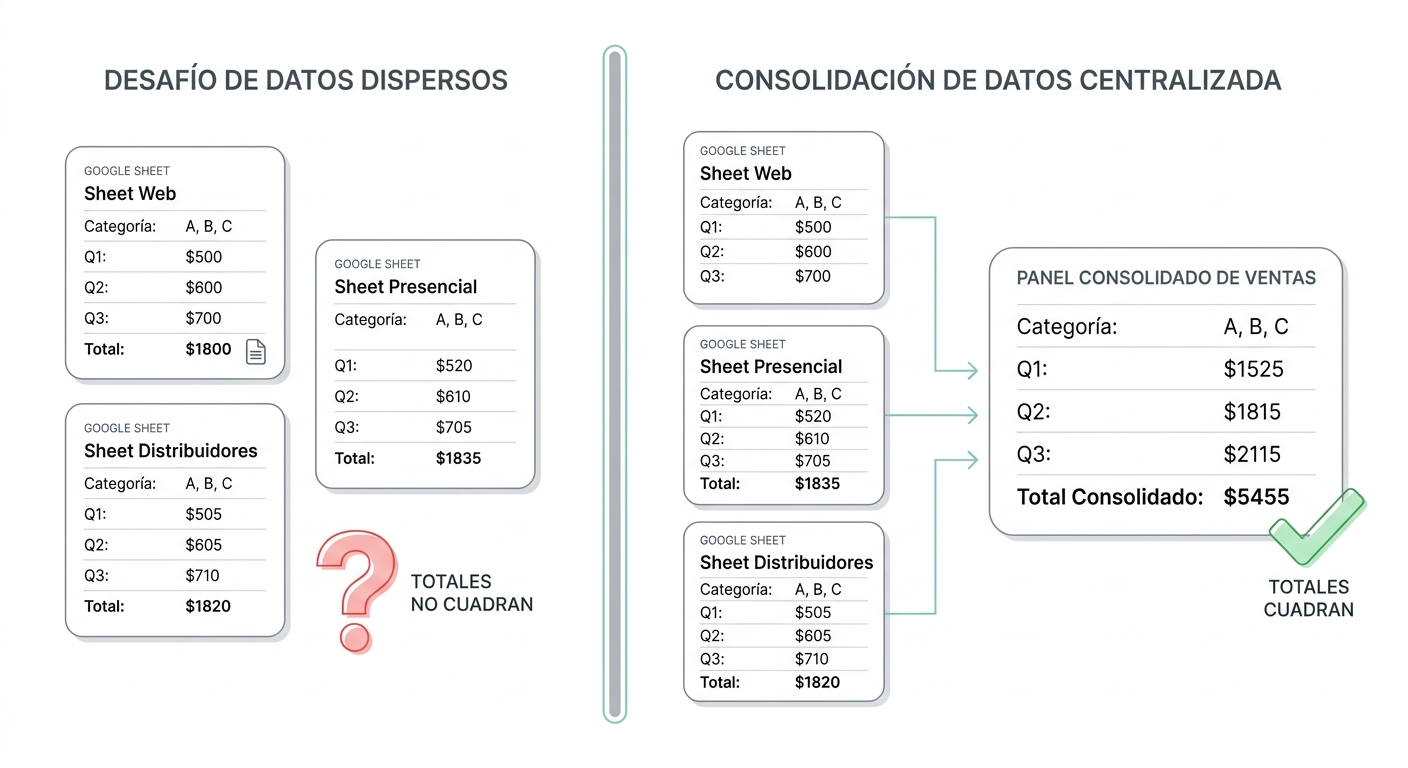
A dashboard that connects those three sources shows a single version of the truth. When all data points to the same panel, the numbers always add up. No exceptions.
What to do Monday: identify the 2-3 sources where you already have data today. Connect those first. Don’t wait for everything to be perfect.
Live dashboard vs static report
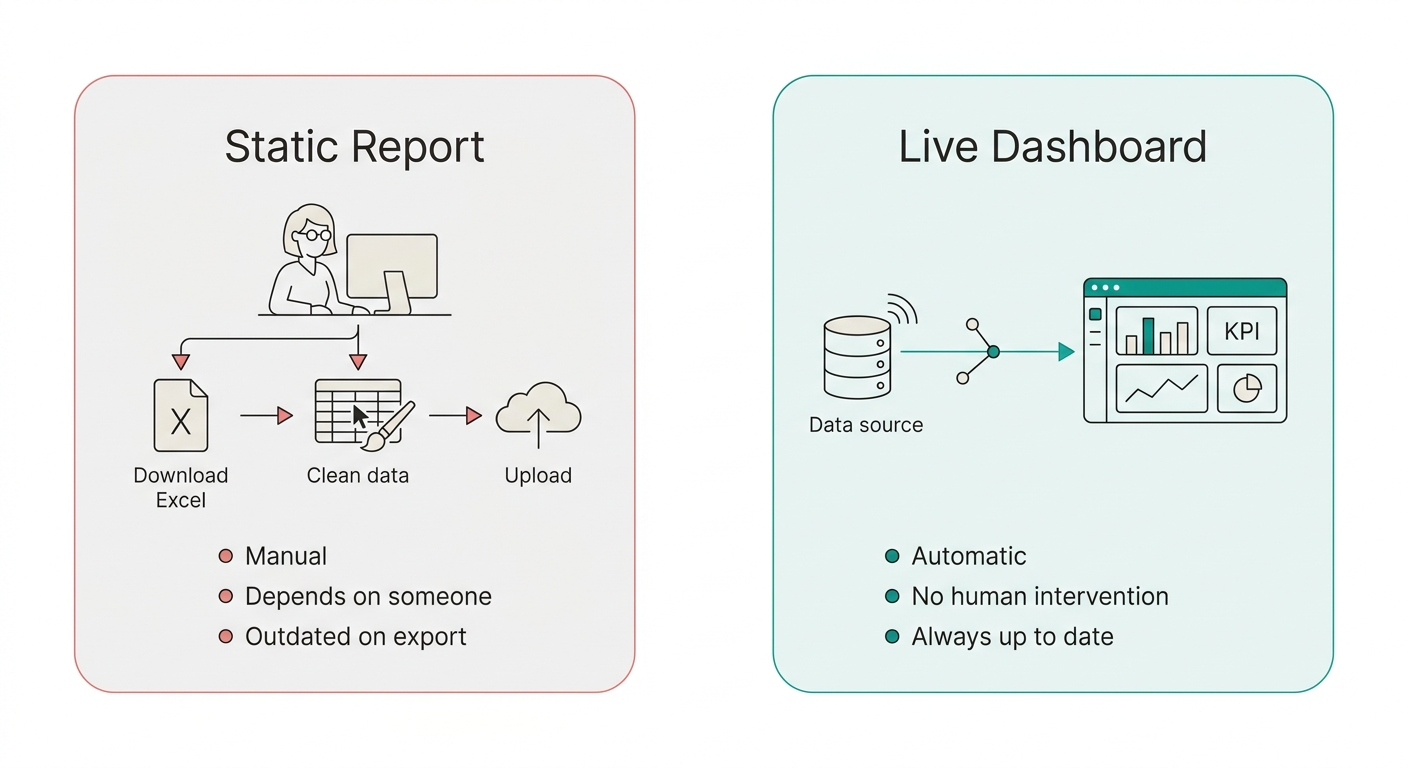
An email report is a snapshot: by the time you finish assembling it, it’s already old. A source connected via API feeds a dashboard that breathes on its own.
- Static report: you export Excel, clean, paste, send by email. It depends on someone doing it — and one day that person gets sick, goes on vacation, or quits.
- Live dashboard: the direct connection updates data automatically. What changes at the source changes on the panel.
The difference isn’t technical. It’s about reliability. A number in an Excel file someone manipulated doesn’t carry the same credibility as a number that comes directly from the business database.
The second step nobody tells you about
Connecting the source is just the beginning. What makes the difference is configuring the business context: how your company defines a sale, what counts as an active customer, how you calculate churn.
Without that context, any tool — including AI — interprets your data generically. With it, the metrics reflect how your company actually operates.
Closing rule
A dashboard without a connected source is a mockup. Pretty, but fake.
Connect one real source. Even just one. And stop building reports on Mondays.
Get started today with
RapidBoard for your team
Early access is open. Join the first 100 spots and start making data-driven decisions faster.