Dashboard ROI: how to measure saved hours, faster decisions, and avoided errors
A dashboard is not a software expense: it is a tool that should return more time, less uncertainty, and fewer errors than any manual report. If you cannot measure that value, it is hard to justify the investment to a CFO.
This post shows you how to translate dashboard benefits into concrete numbers: how much time stops getting trapped in Excel, how much faster decisions happen, and how much you save by avoiding data errors.
By the end, you will be able to answer clearly: is this dashboard worth building? How many weeks or months does it take to pay for itself?
Why dashboard ROI matters more than design
A dashboard has value when it changes what your team does with data.
- If it only impresses people in a meeting, it has no ROI.
- If it reduces the time someone spends in Excel, it has a direct benefit.
- If it helps a decision happen sooner, it avoids future losses.
- If it prevents a key error, that saving can be larger than the cost of the tool.
Measuring ROI helps you answer two critical questions:
- How much value does the dashboard create each month?
- How long does it take to pay for itself?
1. Saved hours: the most obvious return
The first return from a dashboard usually comes from automation.
What stops happening when the dashboard is live
- No more copying and pasting data from 4 different sources.
- No more fixing broken Excel formulas.
- No more searching for the correct version of a report.
- No more emailing PDFs and waiting for read confirmations.
Basic saved-hours formula
Saved hours = Current consolidation hours - Dashboard review hours
Realistic example:
- 2 people spend 5 hours per week each consolidating information.
- With a dashboard, that work becomes 1 hour of review.
- Weekly saving = (2 x 5) - 1 = 9 hours.
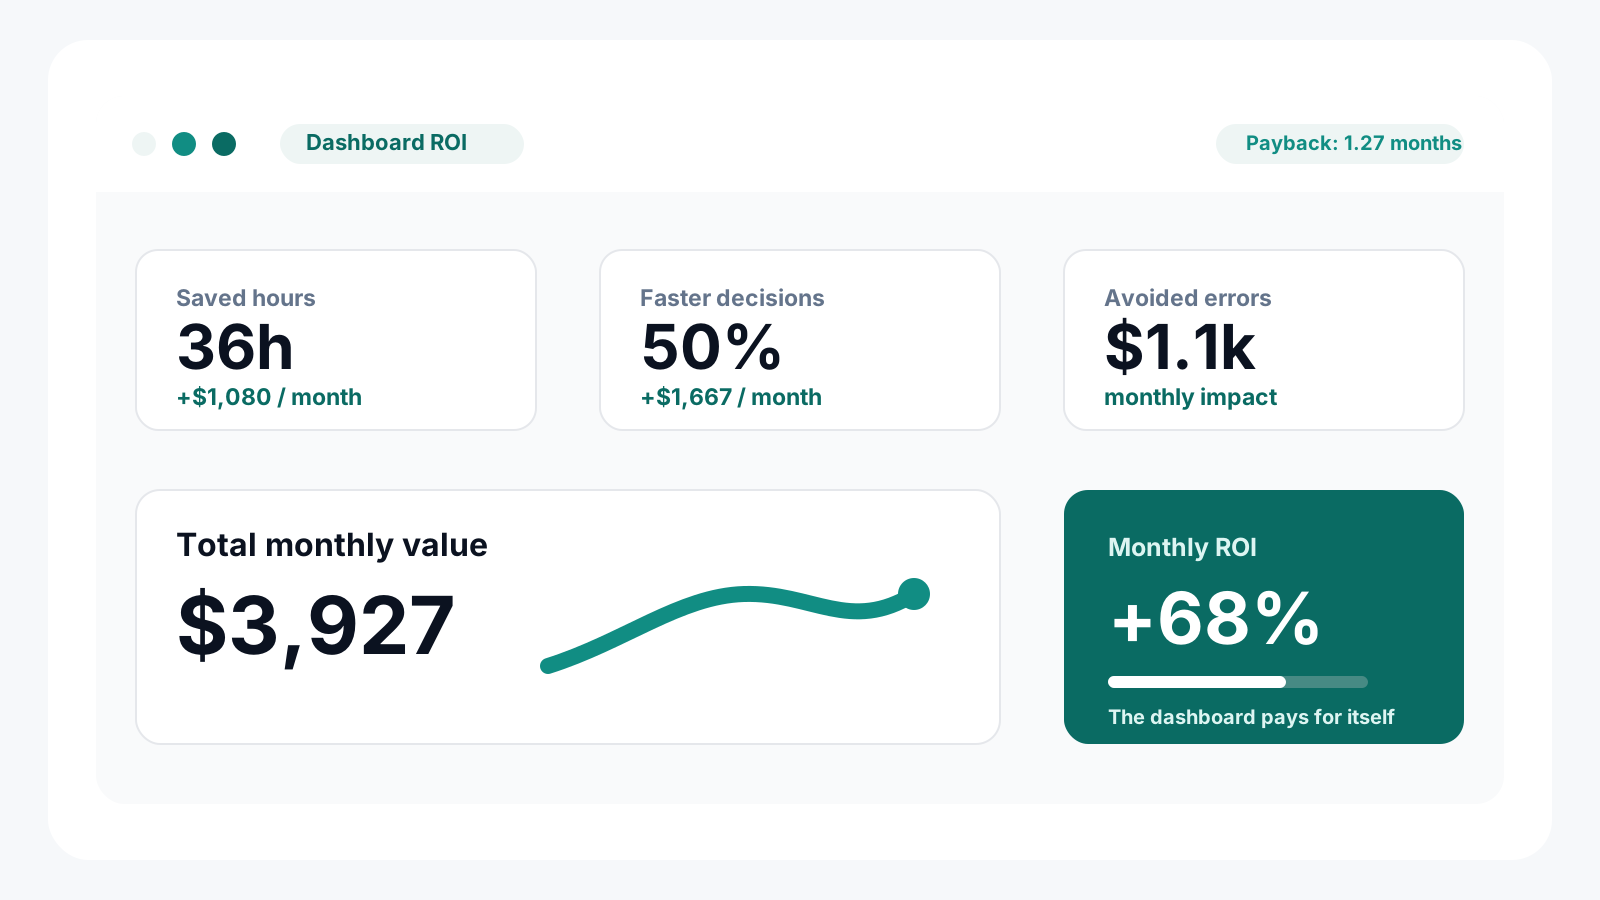
- Monthly saving = 9 x 4 = 36 hours.
If the team’s average hourly cost is $30, that is already $1,080 per month.
2. Faster decisions: the multiplier effect
A dashboard does not only save reporting time. It also accelerates the decision-making process.
Why speed matters
- If an action happens 3 days earlier, it can save sales, reduce stock issues, or avoid penalties.
- When data arrives late, the team may react with outdated information.
- Updated data turns a review meeting into an action meeting.
How to quantify it
Use this approximation:
Impact = Decision value x Probability of acting faster
Example:
- If a delayed decision represents a $10,000 quarterly loss.
- And a dashboard reduces that delay by 50%.
- Monthly dashboard value = $10,000 x 50% / 3 = $1,667.
This is not magic: it is value tied to the ability to react earlier.
3. Avoided errors: invisible but real ROI
Data and calculation errors are a cost that almost never appears in the budget.
Types of errors a dashboard can avoid
- Broken Excel references.
- Old files shared by email.
- Data copied from different sources that does not match.
- Poorly defined metrics interpreted in different ways.
How to put a number on it
Ask your team:
- How often does a reporting error need to be corrected?
- How much time does the correction take?
- What impact did that error have on a decision?
Example:
- A typical error takes 3 hours to resolve.
- It happens 2 times per month.
- Correction cost = 6 hours x $30 = $180.
- If the error causes a bad campaign adjustment, it can add $1,000 in operational impact.
- Potential monthly saving = $1,180.
4. Simple ROI formula
A simple calculation any finance leader can understand:
Monthly ROI = (Monthly dashboard value - Monthly dashboard cost) / Monthly dashboard cost
If the dashboard has no direct monthly cost because your company already pays for the tool, use:
Payback = Implementation cost / Total monthly saving
Practical example
- Saved hours: $1,080
- Faster decisions: $1,667
- Avoided errors: $1,180
- Total monthly value = $3,927
- Dashboard implementation cost = $5,000
- Payback = 5,000 / 3,927 = 1.27 months
That means the dashboard pays for itself in a little over one month.
5. What to include in your business case
You do not need to exaggerate: use real team metrics.
- Current hours spent on consolidation and reporting.
- Frequency of data-error corrections.
- Impact of delayed decisions on sales, inventory, or service.
- Opportunity cost of not having real-time data.
- Time the team would spend configuring or maintaining the dashboard.
Useful data for the CFO
Number of userswho depend on the dashboard.Usage frequency: daily, weekly, monthly.Team sizethat stops doing manual work.Expected value per faster decision.Data qualityand error risk.
6. When the dashboard pays for itself
A dashboard usually justifies its investment when:
- Your team spends more than 10 hours per week on manual reports.
- The business needs weekly or daily decisions.
- More than one data source is in use.
- Meetings often turn into “where did that number come from?” discussions.
- A data error has already caused an incorrect action.
If your answer is yes to any of these, ROI stops being a projection and becomes a need.
7. Keeping ROI over time
ROI is not only about building the dashboard. It is about keeping it useful.
- Review KPIs every quarter.
- Make sure each metric prevents a wrong decision.
- Remove charts nobody uses.
- Adjust thresholds and comparisons when the business changes.
- Keep one owner responsible for the dashboard.
A dashboard with declining ROI is a forgotten dashboard.
8. How to present ROI to your team
The best approach is simple and concrete:
- Show how much time is spent on manual reports today.
- Show how much is saved with automated data.
- Present a real example of a decision that will happen faster.
- Quantify one avoided-error scenario.
- Calculate payback in months.
Key message
You are not selling a chart: you are selling less manual work, fewer endless meetings, and fewer decisions made with expired information.
Conclusion
Measuring dashboard ROI turns a technical investment into a business decision. With clear numbers, the dashboard stops being a nice-to-have tool and becomes a necessary project.
If you want a quick way to start, connect your sources in RapidBoard, identify the KPIs that actually matter, and use these calculations to show how much value your dashboard is already generating.
Get started today with
RapidBoard for your team
Early access is open. Join the first 100 spots and start making data-driven decisions faster.