How to choose the right KPIs for your team
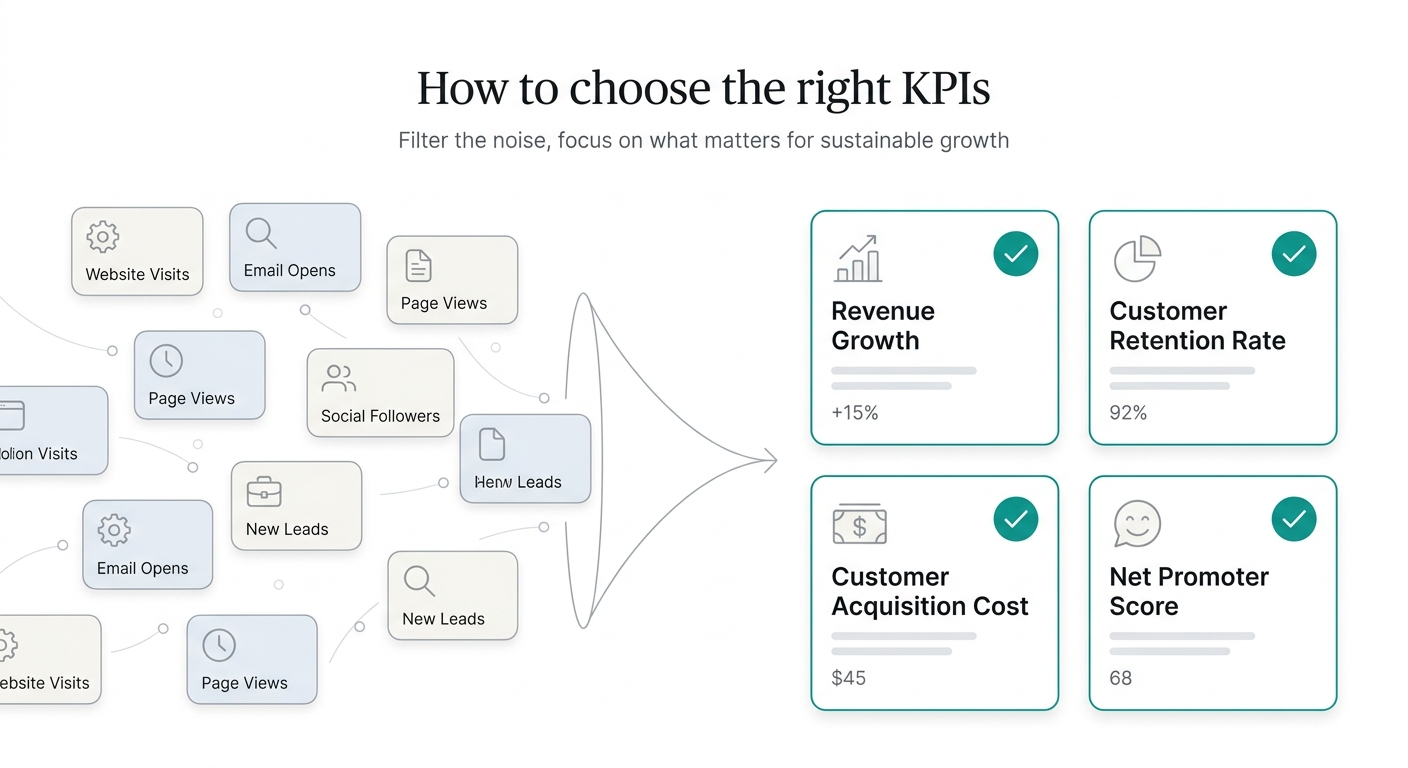
90% of teams that say they measure performance are staring at dashboards full of metrics that don't help them decide anything. Thirty indicators on a panel nobody checks because they don't know where to start.
The mistake isn't measuring too little. It's measuring everything. A KPI that doesn't change a decision isn't a KPI: it's decoration.
A good dashboard has few KPIs, all tied to concrete decisions you make every week.
The 80/20 rule of KPIs
80% of your decisions come from 20% of your metrics. The trick isn’t finding more data: it’s identifying that 20% and ignoring the rest.
- Max 4-6 KPIs per dashboard or tab
- Every KPI must answer: “What do I do Monday morning if this number goes up or down?”
- If no one acts when it changes, it’s not a KPI. It’s decoration. Take it out.
What to do this week: open your current dashboard. For each indicator, ask yourself “the last time this number changed, did I do anything different?” If the answer is no, that indicator doesn’t belong.
Outcome KPIs vs Process KPIs
There are two types of KPIs and you need both. Outcome KPIs tell you if you’re winning. Process KPIs tell you why.
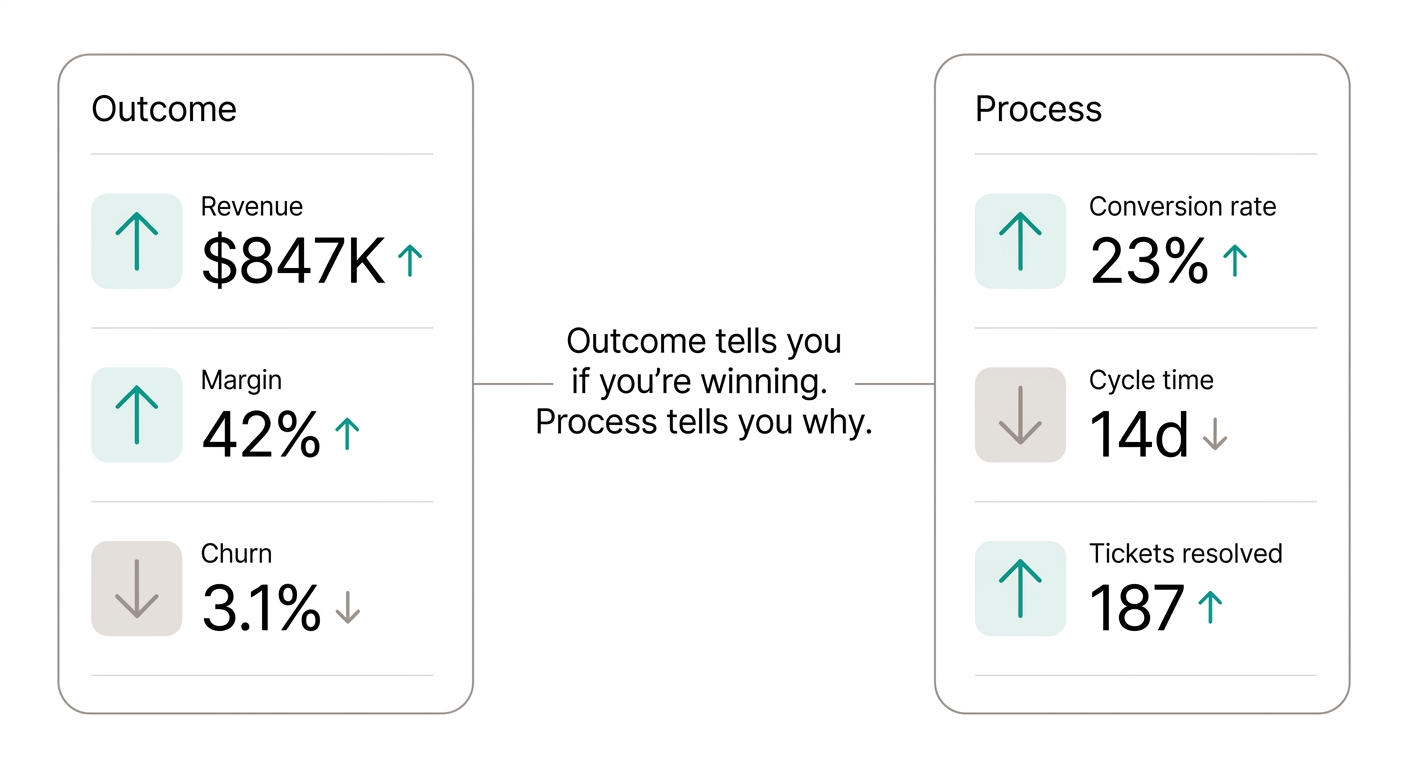
Outcome KPIs — the final scoreboard They measure whether you got where you wanted: monthly revenue, gross margin, churn rate. They’re what you see in the weekly leadership board. The problem: by the time you see them, it’s too late to react.
Process KPIs — what drives the outcome They measure what’s happening right now: pipeline conversion rate, cycle time, tickets resolved per day. These are what let you course-correct before the month ends.
Practical rule: for every outcome KPI on your dashboard, have at least one process KPI that explains how to get there. If revenue is down, you need to know if it’s because conversion dropped or because average deal size slipped.
Carla’s case: from 22 columns to 5 KPIs
Carla is a sales manager at a SaaS company. Her team has 8 reps. Her “dashboard” was an Excel file the analyst sent every Friday with 22 columns. She never knew what to prioritize.
She decided to cut it down to 5 KPIs:
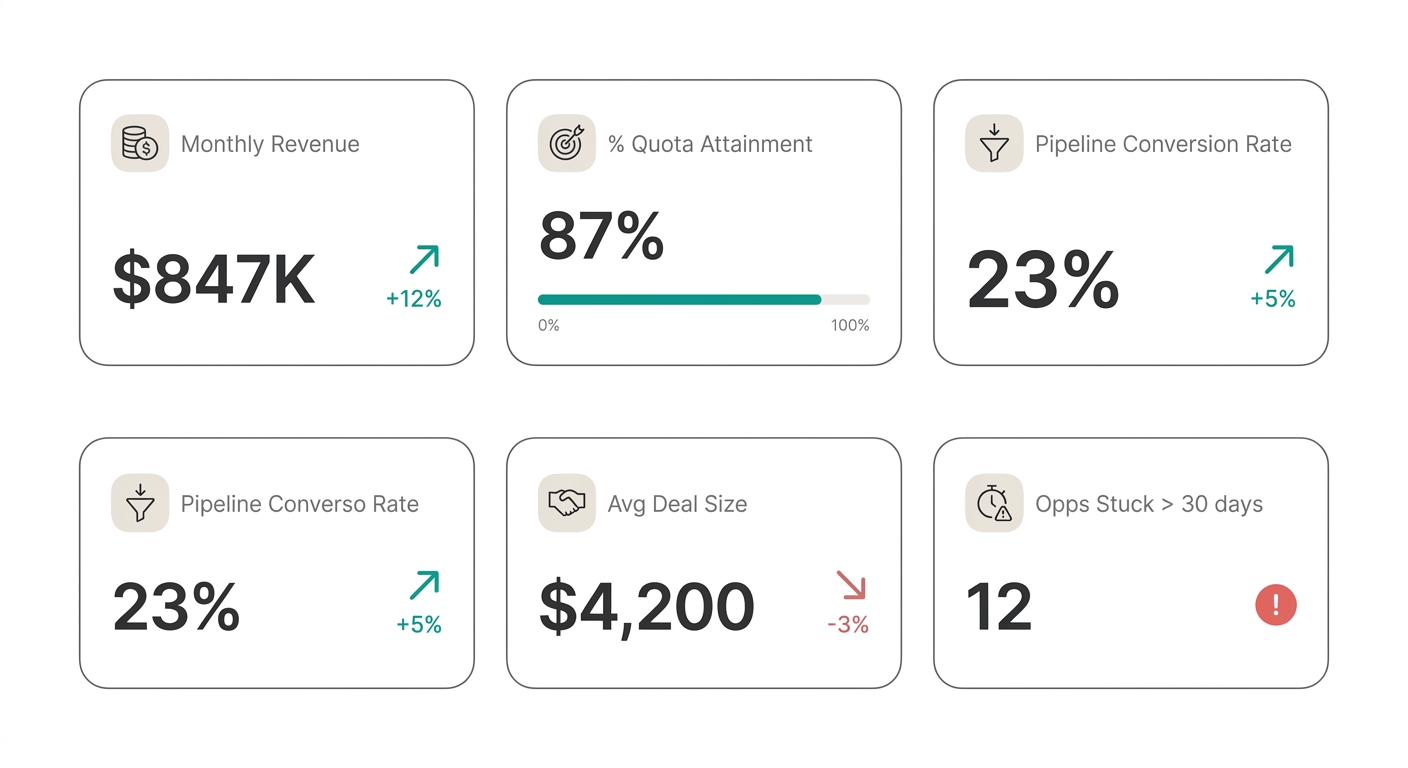
- Monthly revenue (outcome) — if it’s up, celebrate. If it’s down, review pipeline.
- % quota attainment (outcome) — if exceeding, raise target. If low, alert the team.
- Pipeline conversion rate (process) — if up, analyze what’s working. If down, review lead qualification.
- Average deal size (process) — if up, look for upsell. If down, review discounting.
- Opportunities stuck > 30 days (alert) — direct follow-up with the rep.
Every KPI has an associated action. None are decorative.
What Carla does every morning: she opens her dashboard, scans the 5 KPIs in 30 seconds, and knows if the month is on track, which reps need support, and where the risk is. Before, it took her 15 minutes just to understand the Excel.
KPIs by role (what matters to each person)
Each role answers different questions. KPIs should reflect that, not be the same for everyone:
- Leadership: revenue, margin, growth vs target, cash flow — strategic decisions
- Sales manager: pipeline, conversion, average deal size, quota attainment — weekly tactical decisions
- Operations: on-time delivery, inventory, efficiency, bottlenecks — day-to-day decisions
- Finance: accounts receivable, expenses vs budget, profitability by product — early warnings
The final filter: one single question
Before adding any KPI to your dashboard, answer this:
What decision am I going to make with this number?
- Bad: “Sales dashboard”
- Good: “Monitor monthly quota attainment and detect reps with stalled pipeline before month-end”
If the KPI doesn’t help make that decision, it doesn’t belong on the panel. That simple.
Get started today with
RapidBoard for your team
Early access is open. Join the first 100 spots and start making data-driven decisions faster.