Conversational analytics: ask and get answers
RapidBoard · · 6 min read
conversational ai data analysis
+2
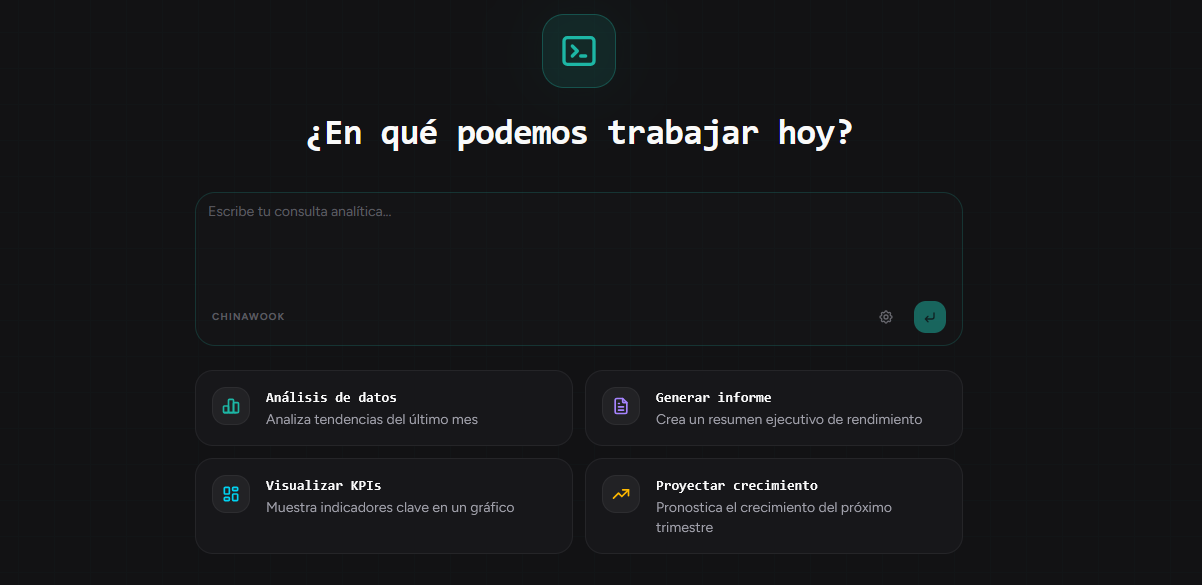
Imagine being able to ask your data like you would ask an analyst: "Who were the top 10 customers by sales this quarter?" or "How does this month compare to the previous one?" and get a chart, table, or KPI instantly.
That's conversational analytics.
How it works
- You select the data source
- You write your question in natural language
- AI interprets the question, generates the query, and runs the analysis
- You get the right visualization: chart, KPI, or table
Why it’s different from a report search
You don’t need to know where the report is or what it’s called. You ask what you need and AI builds the answer on the spot. If the data changes, the answer changes with it.
Transparency in reasoning
In RapidBoard you see how AI interprets your question, what query it generates, and how it reaches the result. It’s not a black box: you can verify and trust the numbers.
Example questions
- “Top 10 products by revenue in the last quarter”
- “How many open tickets does each team have?”
- “Month-over-month sales evolution this year”
- “Which salesperson has the most stalled pipeline?”
Two usage modes
| Mode | Where / What for |
|---|---|
| Analysis chat (Drift) | Chat page — free exploration, ad-hoc questions |
| Dashboard consultant | Side panel inside a dashboard — questions about the metrics you already see |
Early Access
Get started today with
RapidBoard for your team
Early access is open. Join the first 100 spots and start making data-driven decisions faster.
Free during beta • 5-minute setup • No credit card