Business Intelligence: what it is and why it matters
If you work at a company of any size, you make decisions every day. Some with data ('sales are down 15% this month'), others with intuition ('I think this product will work'). Business Intelligence is simply moving the needle: making more decisions with data and fewer with gut feelings.
BI sounds intimidating. It evokes images of ultra-technical dashboards, consultants with English acronyms, and multinational boardrooms. But BI is, at its core, answering business questions with data. 'Why did so many customers leave this month?' is a BI question. 'What was our most profitable product last year?' also is.
In this guide I explain what BI is, what it's for, how it works in practice, and — most importantly — how you can start using it on your team without hiring a data analyst or learning to code.
What is Business Intelligence?
The technical definition: “Business Intelligence is the set of processes, technologies and tools that convert data into useful information for business decision making.”
The definition that matters: BI is stopping making decisions blindly.
Without BI, when asked “Are we going to hit the target this quarter?”, you say “I think so, the team is working well.” With BI, you say “We’re at 67% of the target with 45 days left. At this pace, we project reaching 92%. We need to accelerate 3 big deals or add 2 sales reps.”
BI gives you the difference between believing and knowing.
What BI is for: 5 real use cases
-
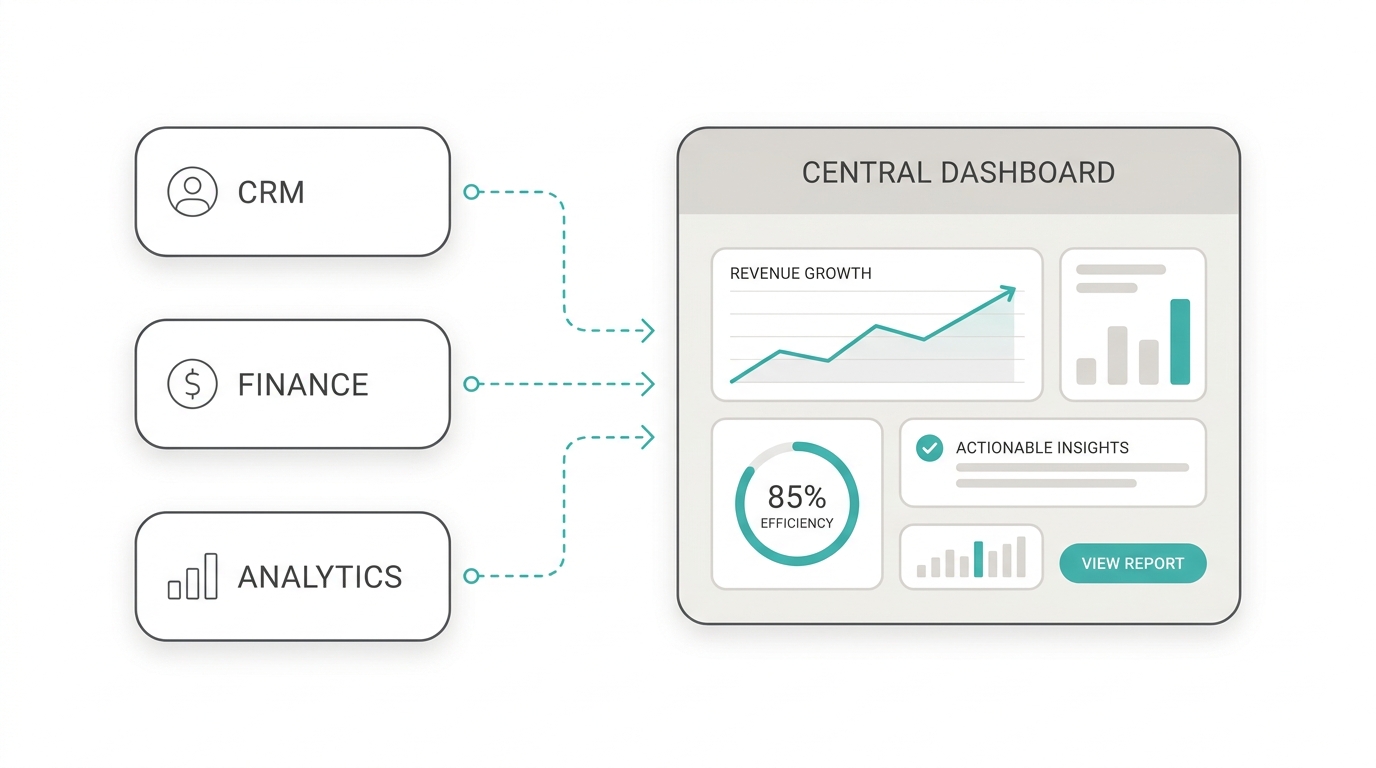
Consolidate scattered information. Your company generates data in 10 different places. BI connects those sources in one place.
-
Detect problems before they hurt. A BI dashboard doesn’t just tell you how last month went. It tells you what’s happening now.
-
Stop arguing about the right number. BI creates a single source of truth. When everyone looks at the same dashboard, the debates about the number end.
-
Automate reports. The weekly report someone builds by copying charts into PowerPoint is work that adds no value. BI automates it.
-
Democratize data access. With BI, dashboards are available to the entire team. Each person can answer their own questions without emailing anyone.
How BI works (explained without jargon)
- Extract — Connect data sources (database, CRM, Google Sheets, APIs)
- Transform — Clean and standardize (fix date formats, unify categories, cross-reference tables)
- Visualize — Build the dashboard (charts, tables, KPI cards that answer business questions)
- Act — Make decisions (the most important and most forgotten step)
BI examples by department
Sales: Open the dashboard at 8 a.m., see live pipeline, stuck opportunities, and monthly close projection. No need to ask each rep to update their forecast.
Finance: Receive an automated report every Friday: 90-day cash flow projection, monthly burn rate, expense variance vs budget by department. No Excel needed.
Marketing: Review dashboard by channel: Google Ads CAC vs organic content CAC vs referral CAC. Move budget from highest CAC channel to lowest. Without BI, that decision happens at year-end, after the budget is spent.
Operations: Receive automatic alert when delivery time exceeds 48 hours. Act before the customer complains.
Do you need a BI team?
10 years ago, implementing BI required a data engineer, analyst, designer, and project manager. Minimum setup cost USD 50,000 and took 6 months.
Today, tools like RapidBoard changed the equation. You connect your own sources in minutes, without writing code. AI builds the dashboard for you.
You need a dedicated BI team if: 500+ employees, need complex predictive models, require corporate data governance.
You DON’T need a BI team if: you want to visualize data in simple dashboards, your team can describe what metrics they need, your data lives in standard tools (CRM, Google Sheets, databases).
Top 5 BI tools
| Tool | Best for | Starting price | Learning curve |
|---|---|---|---|
| Power BI | Microsoft 365 enterprises | USD 10/user/mo | High |
| Tableau | Advanced visualization | USD 75/user/mo | High |
| Looker Studio | Google ecosystem | Free | Medium |
| Metabase | Technical startups | Free / USD 85 | Medium |
| RapidBoard | LATAM teams without analysts | From USD 0 | Low |
How to start with BI: 3 steps
- Pick one question. Don’t try to measure everything from day one. Pick one important question.
- Connect the needed sources. Identify where the data lives and connect it.
- Review the dashboard with your team weekly. A dashboard only one person looks at isn’t BI — it’s a personal report.
Get started today with
RapidBoard for your team
Early access is open. Join the first 100 spots and start making data-driven decisions faster.