Business Intelligence: 4 real-world company examples
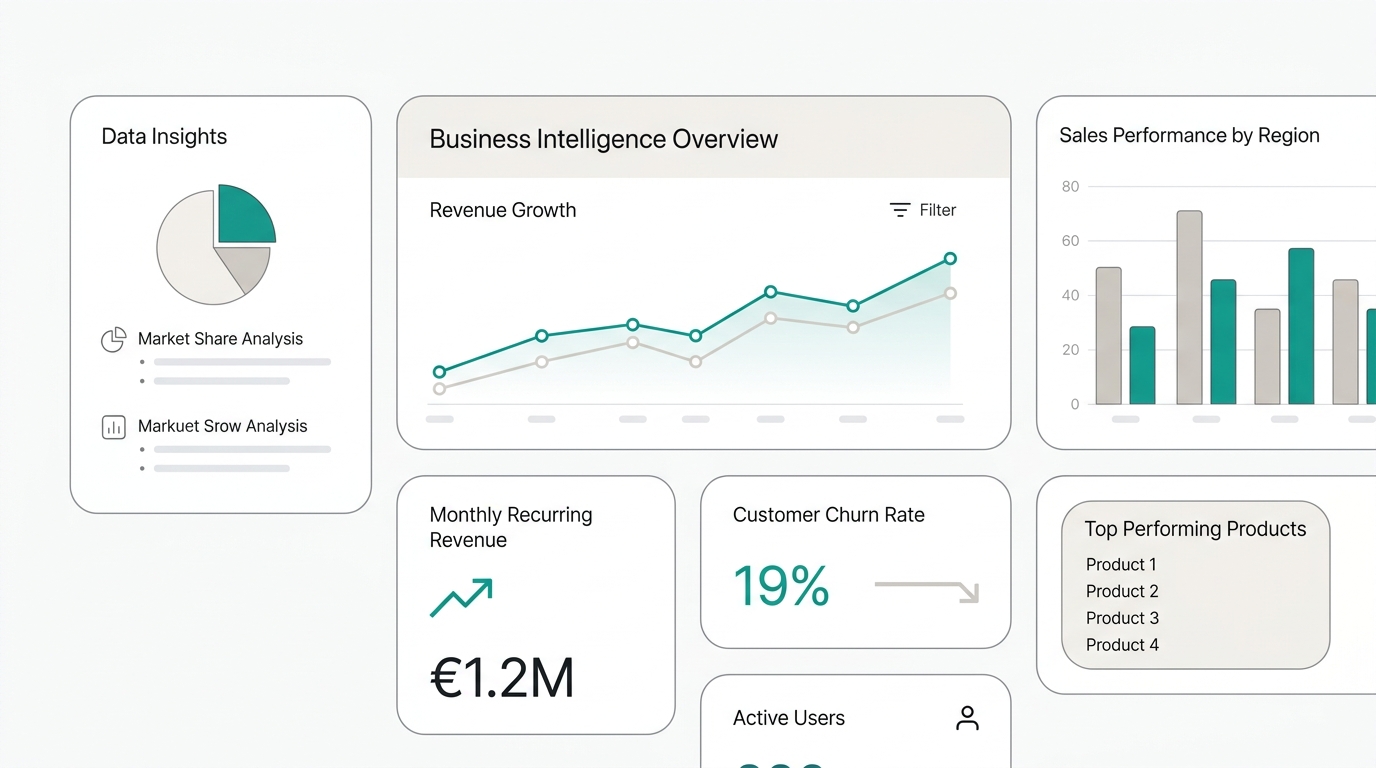
Talking about business intelligence in the abstract is easy. The hard part is visualizing how it applies to a company like yours. What really changes when a team goes from deciding with intuition to deciding with dashboards? How much impact does it have on the numbers?
In this guide I share 4 real cases of companies that applied BI to solve concrete business problems. They're not multinationals with million-dollar budgets: they're mid-scale companies, with small teams and real needs, that used dashboards to make faster, more precise decisions.
Case 1: Retail — 37% reduction in stockouts
The company: Chain of 12 home goods stores across 3 cities.
The problem: Every month, 4 out of 10 star products were out of stock before the weekend. Store managers ordered replenishment “by eye.” Result: lost Saturday sales (the highest-traffic day) and customers going to competitors.
The BI solution: Connected POS system with inventory in a live dashboard. Created a board with the 50 highest-turnover products and visual alerts: green (stock > 7 days), yellow (stock 3-7 days), red (stock < 3 days). Added a simple KPI: “Products out of stock on Saturdays.”
The result: In 3 months, Saturday stockouts dropped 37%. The dashboard required nothing more than connecting two existing sources and defining alert thresholds.
Case 2: Logistics — 22% reduction in fuel costs
The company: Fleet of 40 distribution trucks in metropolitan Lima.
The problem: Fuel costs varied from 18% to 35% of total delivery cost with no clear explanation. Some drivers spent twice as much as others on the same route.
The BI solution: Connected GPS data and fuel consumption records. Created a dashboard with metrics by vehicle and driver: km driven, liters consumed, efficiency (km/liter). Added comparison between similar routes.
The result: Identified 7 inefficient routes and redesigned them. Detected 3 vehicles with mechanical problems causing excess consumption. Implemented an efficiency ranking by driver (with training, not punishment). Fuel cost dropped from 27% to 22% of total cost in 4 months.
Case 3: SaaS — Tripled new customer retention
The company: Project management SaaS startup with 1,200 active customers.
The problem: 25% of customers canceled before 90 days. CAC was USD 280, so every early-canceling customer was a direct loss.
The BI solution: Cross-referenced product usage data with cancellation data. Discovered that customers who completed 3 specific actions in their first 7 days were 80% less likely to cancel. Those 3 actions became an activation dashboard.
The result: Redesigned onboarding to guide every new customer toward those 3 actions. CS team received automatic alerts if a customer hadn’t completed them by day 5. In 6 months, 90-day retention went from 75% to 89%.
Case 4: Healthcare — 41% reduction in wait times
The company: Network of 5 outpatient clinics with 80 doctors.
The problem: Patients waited an average of 52 minutes, with 2-hour peaks during high-demand periods. Satisfaction surveys showed wait time was the #1 dissatisfaction driver.
The BI solution: Connected appointment system with actual service times. Created a dashboard with 3 KPIs: average wait time by time slot, patient no-show rate, consultation duration by doctor. Discovered Monday 8-10 a.m. had 35% no-shows (empty offices) while 4-7 p.m. had 90-minute waits.
The result: Redistributed appointments from saturated slots to morning gaps. Implemented automatic WhatsApp confirmation (reduced no-shows to 12%). Identified 3 doctors with 40% longer-than-average consultations (schedule adjustment, not quality issue). Average wait time dropped from 52 to 31 minutes in 3 months. Patient satisfaction rose 18 points.
The pattern across all 4 cases
- They didn’t start with technology. They started with a business question: why do we run out of stock on Saturdays? Why do some drivers spend twice as much fuel?
- The data already existed. POS, GPS, appointment system. BI didn’t require generating new data — it just connected what was already there but no one was looking at together.
- The dashboard led to a concrete action. Redesigning routes, changing onboarding, redistributing appointments. The dashboard wasn’t the end — it was the means to make a decision.
- The impact was measurable. 37% fewer stockouts, 22% less fuel, 14 more retention points, 41% less waiting. BI without measurable impact is just decoration.
Get started today with
RapidBoard for your team
Early access is open. Join the first 100 spots and start making data-driven decisions faster.