Marketing KPIs: 10 examples every team should track
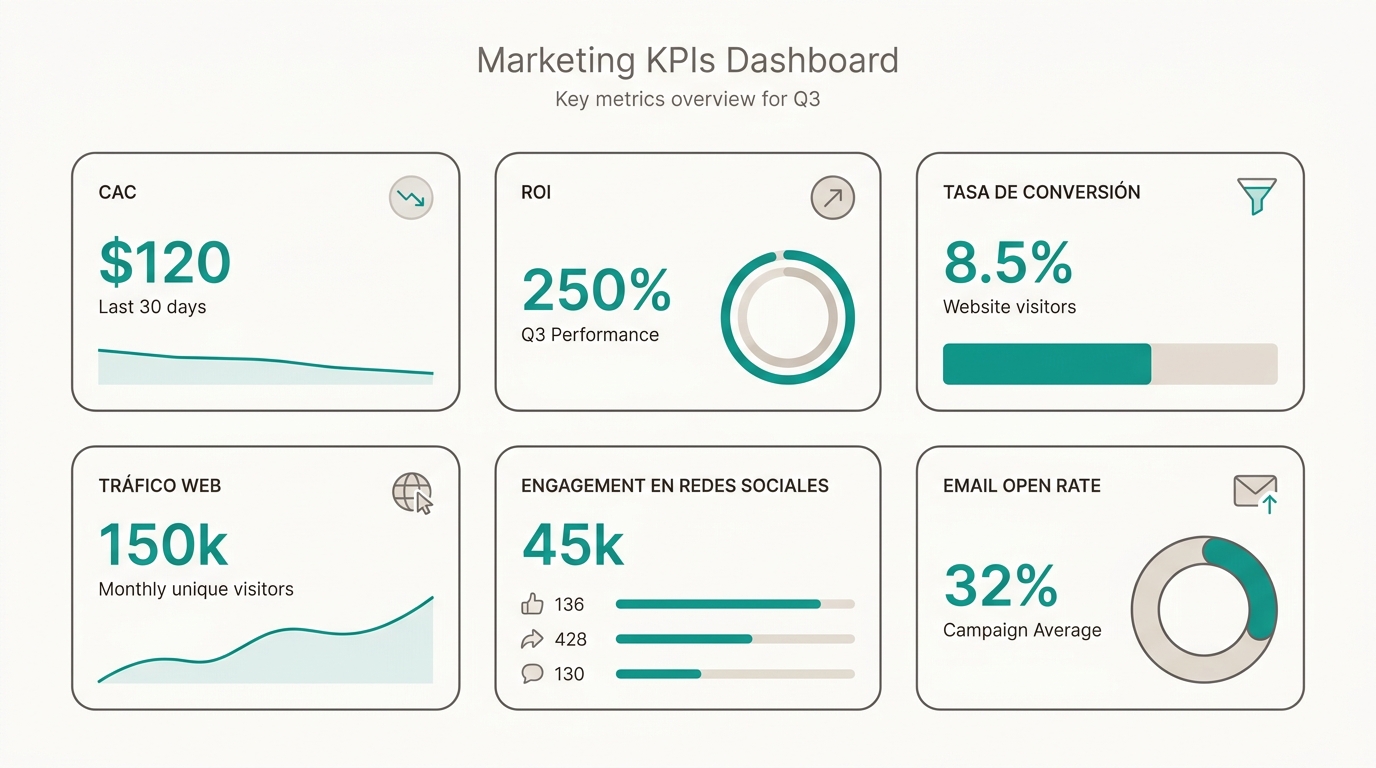
Marketing generates more data than almost any other department — traffic, leads, conversions, campaigns, social media — yet paradoxically it's the hardest to connect to business results. The problem isn't lack of data: it's too many metrics that don't lead to any decision.
In this guide I share the 10 marketing KPIs that actually matter — the ones that connect to revenue, the ones your CFO understands, and the ones that replace vanity metrics that only exist to fill PowerPoint slides.
Why most marketing dashboards fail
Open almost any company’s marketing dashboard and you’ll find: sessions, page views, bounce rate, Instagram followers, impressions, email open rates. All metrics that answer “how much activity did we have?” None answer “did that activity generate revenue?”
The perfect marketing dashboard has three layers:
- Business metrics (top): CAC, ROI, attributed revenue
- Funnel metrics (middle): MQL to SQL conversion, pipeline generated
- Channel metrics (bottom): traffic, CPL, engagement — only if they connect to the layers above
The 10 marketing KPIs you should be measuring
1. CAC — Customer Acquisition Cost
Formula: Total marketing and sales spend / New customers acquired. The most important marketing KPI. If your CAC is higher than the value a customer generates, your business loses money.
2. ROI by channel
Formula: (Revenue generated by channel - Channel cost) / Channel cost × 100. Not all customer sources are equal. Segment by channel: Google Ads CAC vs organic content CAC vs referral CAC.
3. MQL — Marketing Qualified Lead
Define what an MQL is in your company. Typically: visited pricing page, downloaded a case study, opened 3+ emails, has decision-making role, works at a target-size company.
4. MQL to SQL conversion
The bridge between marketing and sales. Formula: SQLs generated / MQLs generated. Below 20%: marketing and sales aren’t aligned. 20-40%: acceptable. Above 40%: excellent alignment.
5. CPL — Cost per Lead
Formula: Channel spend / Leads generated. Useful for comparing channels without waiting for the full sales cycle.
6. Lead to customer conversion rate
Formula: New customers / Total leads × 100. Effectiveness of the complete process from first click to signed contract.
7. LTV — Customer Lifetime Value
The counterweight to CAC. Simple formula: Average ticket × Purchases per year × Average years of retention. A healthy LTV:CAC ratio is 3:1.
8. Share of Voice
Your brand presence vs competitors in the market. Useful for justifying brand investment that doesn’t show in direct conversion metrics.
9. Customer retention rate (marketing-influenced)
Retention is shared with customer success, but marketing impacts it through onboarding, educational content, community, and post-sale communication.
10. ROAS — Return on Ad Spend
Formula: Revenue attributed to campaign / Campaign cost. More immediate than ROI. A ROAS of 4:1 means every dollar invested returned 4.
How to structure a marketing dashboard your CFO understands
Top section — the 3 numbers that matter: CAC (6-month trend), Marketing ROI (attributed revenue / spend), Pipeline generated (total value of created opportunities).
Middle section — live funnel: Leads → MQL → SQL → Customer with conversion rates between each stage, compared to previous month.
Bottom section — channels: ROI by channel (organic, paid, referrals, outbound), CPL by channel, CAC by channel (3 months of history).
Common mistakes
Mistake 1: Last-click attribution. Attributing everything to the last ad before purchase ignores the 7 prior touchpoints. Implement multi-touch attribution or at least compare first and last click.
Mistake 2: Comparing channels without context. Don’t compare apples to oranges.
Mistake 3: Not closing the loop with sales. If your dashboard ends at “lead generated” and you don’t know how many became customers, you’re measuring effort, not results.
Get started today with
RapidBoard for your team
Early access is open. Join the first 100 spots and start making data-driven decisions faster.